Efforts to Convince and Clarify Points to the IITM Team
During the development of sensors for wave impact analysis
4/16/20249 min read
Significant experiments were conducted in Cochin and Vizhinjam, near Thiruvananthapuram, to demonstrate the operational principles of the wave impact analysis system to the professors. These experiments were aimed at validating the design and functionality of the sensor, with key observations made in two distinct setups as outlined below:
Experiment A:
In Gandhi Nagar, Cochin, adjacent to a building under construction, a 20-meter tall water column was erected vertically. This setup was designed to simulate 5 cm high waves at the top, with the wave impact sensor immersed at various heights within the column. Despite the expectations based on wave dynamics theory—which suggests that sensor responses should vary non-linearly with depth—the observed signal responses remained consistent across different heights. This outcome appeared to contradict the established principles of wave dynamics, prompting further investigation.
Experiment B:
The investigation was extended to the Vizhinjam port area, which offered access to greater water depths. Here, the sensor was immersed at various depths to observe its performance under more varied conditions. Contrary to the findings in Cochin, the results in Vizhinjam adhered to the principles of wave dynamics, demonstrating that wave impact decreased proportionally with depth. This experiment underscored the sensor's capacity to reflect the expected nonlinear response to different water depths, aligning with theoretical predictions.
These experiments played a crucial role in clarifying the operational principles and effectiveness of the wave impact analysis sensor, especially in demonstrating its capability to accurately measure wave impact in alignment with the foundational principles of wave dynamics under varying conditions.
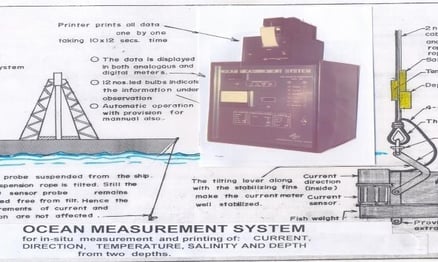
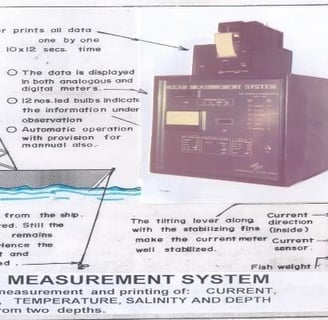
Figure 71: Ocean Measurement System developed for the Oil and Natural Gas Corporation (ONGC) for recording and analyzing water dynamics and water quality around oil rigs operating in Bombay High at various depths. The system employs 10 sensors, including a streamlined design of an ocean current sensor and other sensors attached to the underwater probe. The water-based data acquired include salinity, conductivity, temperature, water current, current direction, and operational depth.
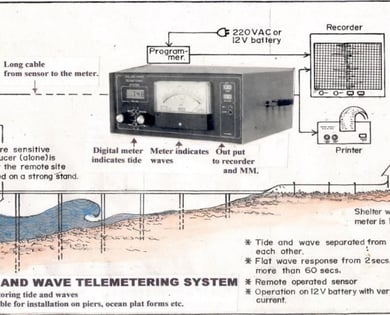
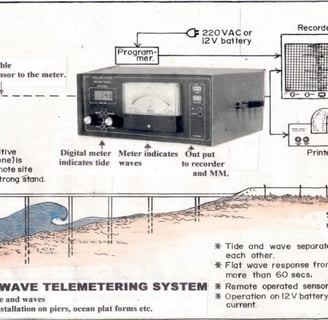
Figure 72: Tide and Wave Telemetering System developed for the Centre for Earth Science Studies (CESS), Thiruvananthapuram, as part of the project on Coastal Protection Measures for analyzing coastal engineering parameters. Several systems were installed in Thiruvananthapuram, Quilon, Alappuzha, Calicut, Thalassery, and the Gujarat Coast under the Gujarat Maritime Board (GMB) scheme, with much live data acquired continuously for more than 15 years.
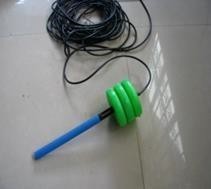

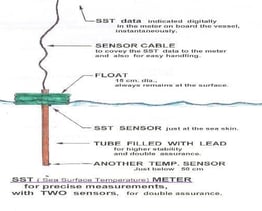
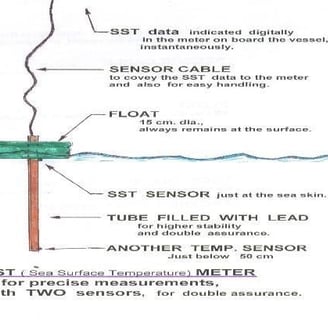
Figure. 72. SST SENSOR | Figure 73: SST (Sea Surface Temperature) sensor in a floating condition on the water surface, sending signals to the meter through its long cable. This is also a revolutionary simple idea, frequently required in oceanographic measurements, compared to its conventional, elaborate, and expensive counterpart, with many advantages, including continuous operation.
Figure 74: Detection of Thermal Waves in the Bay of Bengal, a large experiment conducted for CSIR-NIO, Goa, at the Vaisagh Center, by developing a 120 m long flexible thermal sensor, to detect the thermal waves believed to be present in ocean depths. The peculiar data has been published by NIO. Reference: Annex-N.
This extensive experiment was implemented to detect and reveal the truth behind the concept in oceanography that such a rare phenomenon exists in ocean depths. The experiment was conducted in the Bay of Bengal, and the results have been published by scientists of NIO-Vaisagh. Data analyzed and published in many related journals by scientists of CSIR-NIO. Details in Annex-O.
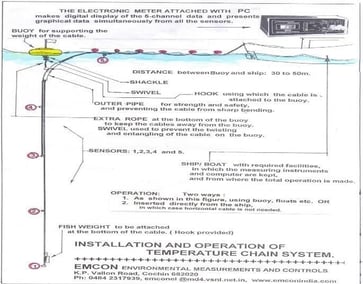
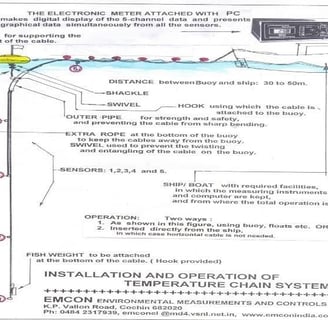
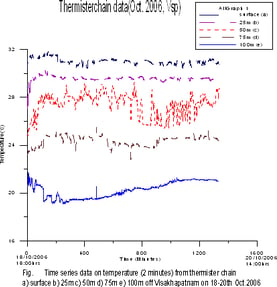
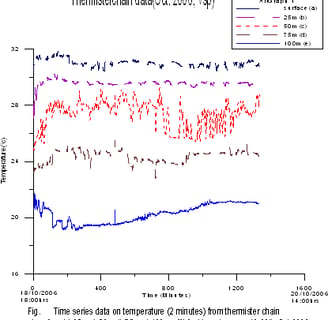
Figure 75: The Unusual Temperature Fluctuating Data from Ocean Depth Acquired from the Bay of Bengal by scientists of CSIR-NIO-Vaisagh shows the rare data from a Thermistor Chain developed by EMCON-Cochin. The experiment was repeated, with scientists and EMCON staff, including Mr. T.D. Joshy and Mr. Sreejith, T.S., waiting on the ship off Vaisagh.
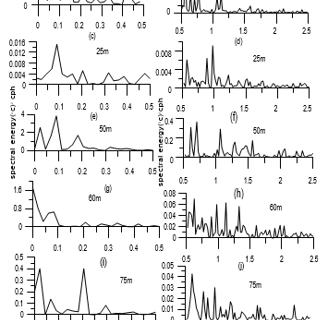
Thermister Temperature Data
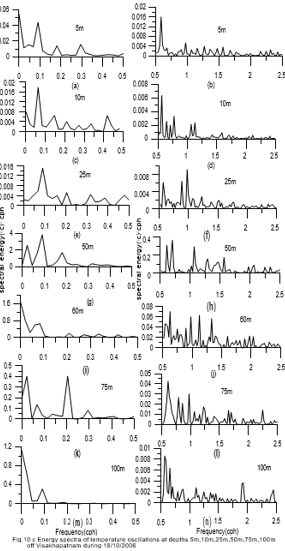
Spectrum Analysis
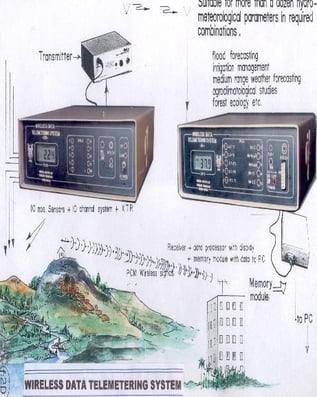
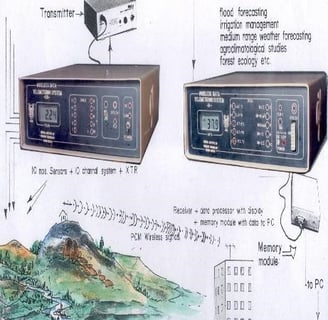
Figure 76: Wireless Data Transmission System developed at CIFT for point-to-point data transmission in the initial years when advanced methods such as GPRS and IoT were not available. This system was used for demonstrations during several national training courses conducted.
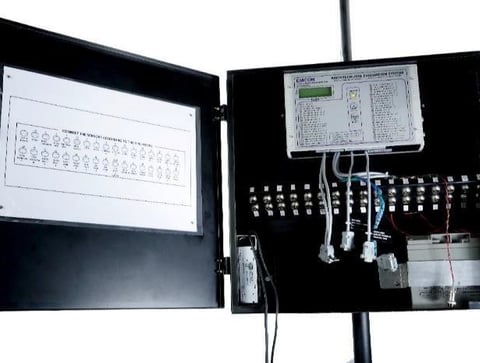
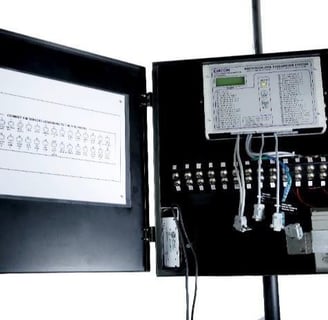
Figure 77: Architectural and Structural Evaluation System developed and mounted on a mast, complete with its sensors, developed for investigations on comfort parameters and also for the comparison of different buildings and other structures, including old and new bridges, dams, and other special structures. Installed at NITC, Madurai University, TKM Engineering College - Kollam, etc. Details of plenty of new investigations made possible are available in Annex-P.
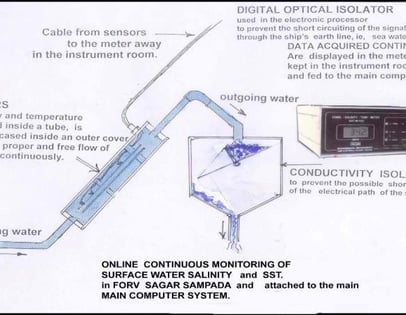
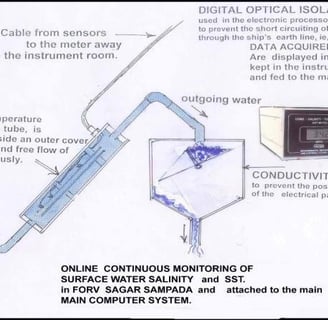
Figure 78: Automatic continuous recording of SST (Sea Surface Temperature) and SSS (Sea Surface Salinity) on the research vessel Sagar Sampada of the Department of Oceanography (DOD), Government of India, with data being fed to a computer. The observation system developed for Sagar Sampada by the DOD, Government of India, was installed for continuous measurements of SSS (Sea Surface Salinity) and SST (Sea Surface Temperature), tailored to match the ship's requirements.
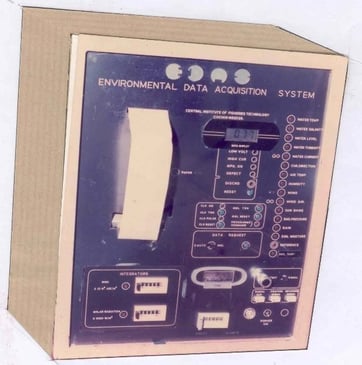
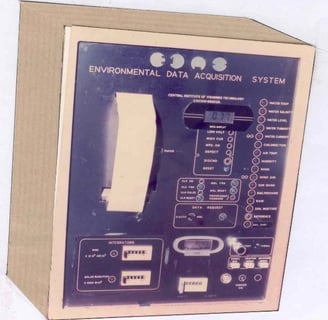
Figure 79: Another design of EDAS (Environmental Data Acquisition System) developed with its built-in printer for printing the data simultaneously in real-time, along with data integrators.
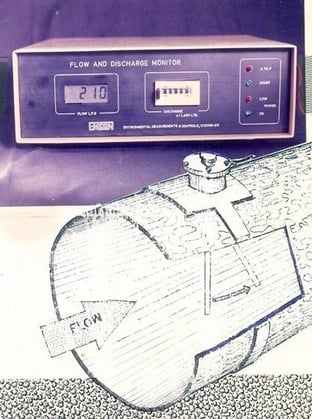
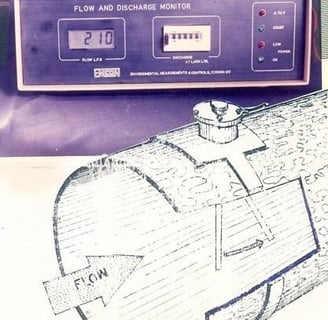
Figure 80: Flow and Discharge Measurements in large pipelines. The principle developed is based on the tilting of a hydrodynamic lever proportional to water flow, a totally new method found to be very sensitive and accurate, as per the test and calibration certificate from the CWPRS towing tank. Several Flow and Discharge (F&D) meters were installed for the Kerala Water Authority and also in other states like Karnataka and Gujarat. The data for both flow rate and total discharge are displayed continuously on digital meters, with a data recording facility in a computer or memory module. Details, including the Calibration chart of CWPRS, are in Annex-Q.
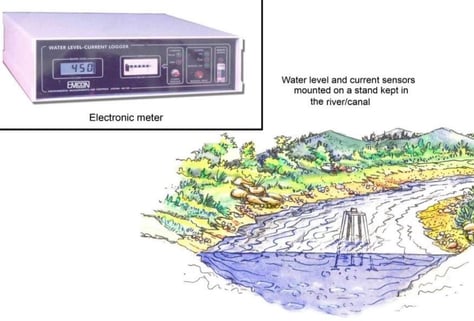
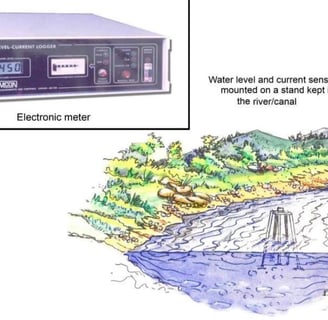
Figure 81: Water Flow and Discharge Monitors, developed for the M.S. Swaminathan Research Foundation (MSSRF) – Chennai, for rivers. The equipment was installed in the rivers of Kaveri and Krishna in Andhra Pradesh for the studies conducted by MSSRF-Chennai. It consists of sensors for water flow and water level, mounted on a stand in the middle of the river, from which data are processed. A data logger with a built-in memory card and battery is kept on top of a tree in a nearby location.
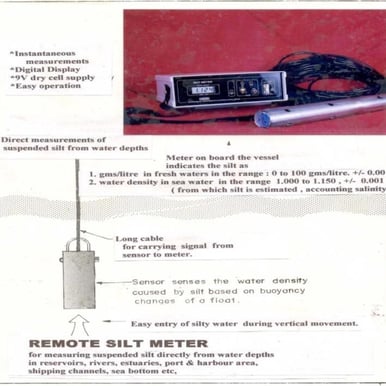
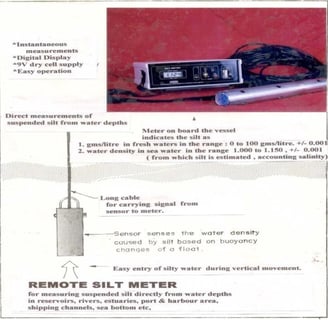
Figure 82: Remote Silt Meter developed for direct measurement from water depths in dams, rivers, and backwaters, without requiring the collection of water samples. Installed at CIFT, CUSAT, KUFOS.
Figure 83: Automatic Silt Recording System developed for Orissa. Water is pumped into the sampling unit, where the measurement is conducted. Measurements are carried out automatically at preset times, and data are recorded in the memory unit with real-time timestamps. The system is designed for measuring suspended silt from running water of canals, streams, rivers, etc., with many units installed in Orissa.
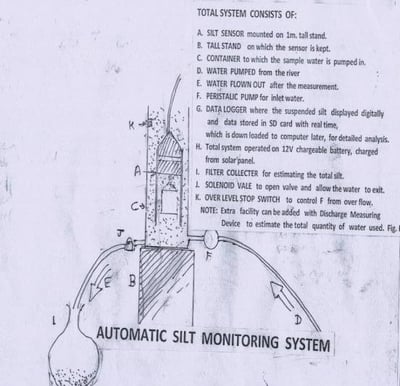
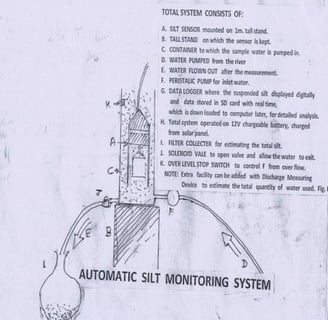
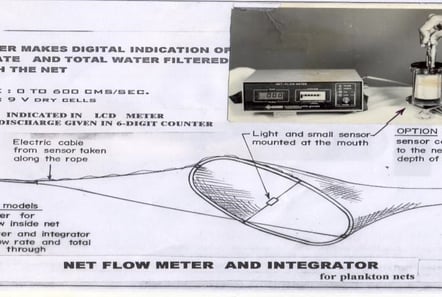
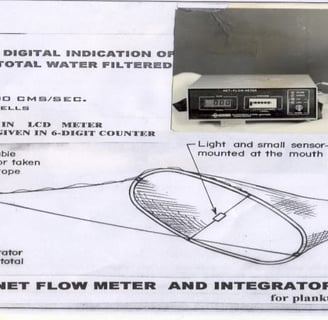
Figure 84: Net-Flow Meter and Integrator developed for simultaneous measurements of both the flow rate and total discharge of water passed through the net.
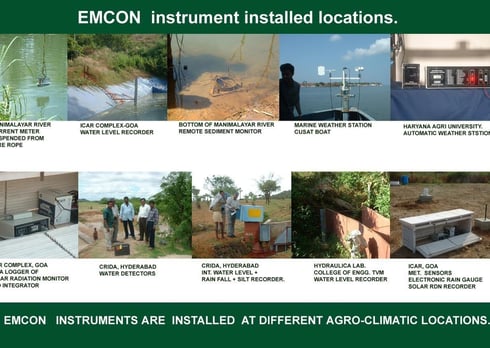
Figure 85: Some cases of different field experiments conducted using field instruments made by EMCON, developed by the author.
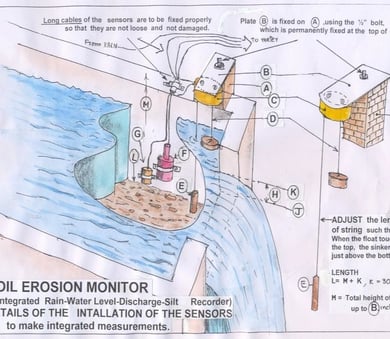
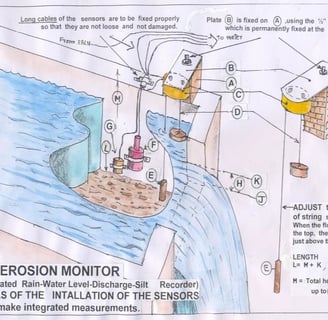
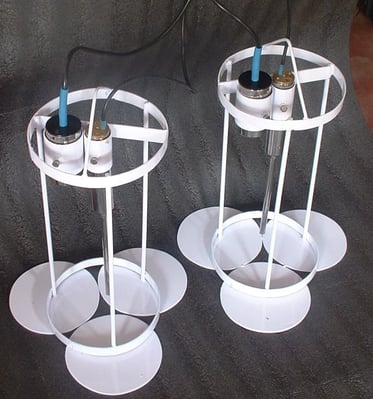
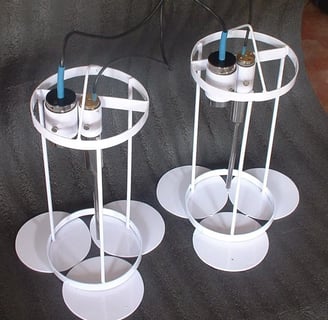
Figure 86: Structural view of the Soil Erosion Monitor developed for investigations on the integrated result of the respective operational parameters of flow rate, water level, and suspended silt, at the National Technological University, Ratnagiri, Maharashtra.
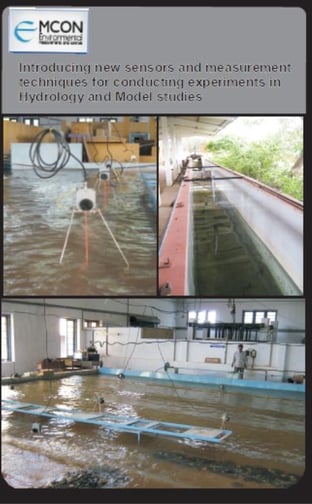
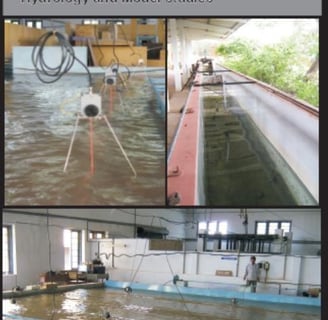
Figure 87: Wave and Oscillatory Water Current Sensors were developed to record the oscillatory water current caused by coastal waves, for studies on the rare coastal phenomenon known as “Chakara,” occurring on the Kerala coast during the monsoon. The project was undertaken by the Marine Geology Department of CUSAT and NPOL under a DST scheme, to study this rare coastal phenomenon, as shown in Fig. XX. The two sets of sensors can be placed at two locations along the path of ocean waves, allowing the changes in ocean waves to be sensed and analyzed as they approach the shore. Such information is highly significant in connection with the development of tsunami warning systems.
Figure 87: Wave and Oscillatory Water Current Sensors were developed to record the oscillatory water current caused by coastal waves, for studies on the rare coastal phenomenon known as “Chakara,” occurring on the Kerala coast during the monsoon. The project was undertaken by the Marine Geology Department of CUSAT and NPOL under a DST scheme, to study this rare coastal phenomenon, as shown in Fig. XX. The two sets of sensors can be placed at two locations along the path of ocean waves, allowing the changes in ocean waves to be sensed and analyzed as they approach the shore. Such information is highly significant in connection with the development of tsunami warning systems.
Figure 88: Hydrodynamic Model Tanks developed for the College of Engineering Trivandrum (CET-Tvm) and the National Institute of Technology Karnataka (NITK), for conducting model experiments on ocean waves, tide, water current, etc., under laboratory conditions. Several other sensors have been developed and installed at CET, NITC, NITK, NIOT, etc., for specific investigations on the impact of coastal ocean waves on hydrodynamic behavior and impact forces on coastal structures. Details are available in Annexure-R.
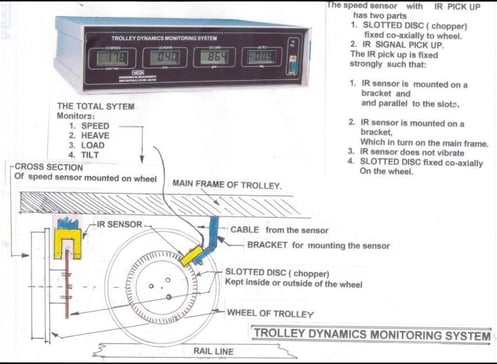
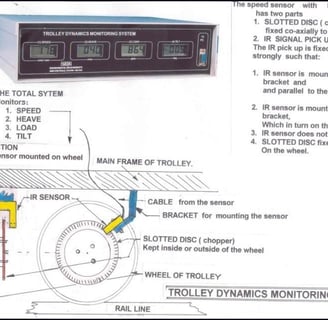
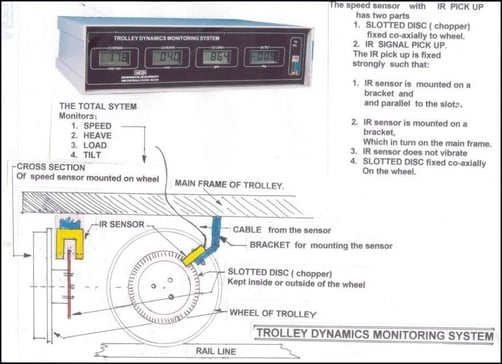
Figure 90: Trolley Dynamics Monitoring System developed and implemented at NITC-Kozhikode for testing and calibration of dynamic systems in towing tanks. The system displays and records four operational parameters simultaneously: speed, heave, underwater load, and tilt of the towed body, unlike other towing tests.
The illustrated cases given here are only a few among more than 500 developed with fully indigenous technology for different applied areas to meet the specific needs of various R&D organizations affiliated with ICAR, CSIR, DRDO, DOES, IITs, NITs, ONGC, GIS, many universities, and other departments, etc.
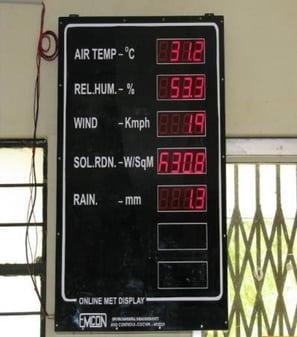
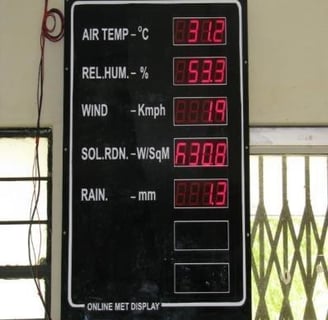
Live Digital Mega Display of Weather Parameters: Many R&D institutes have implemented digital displays of data visible to the public and others, obtaining the respective data from AWS and other instruments. Some of the data include: A. Meteorological data, B. Water quality data on water temperature, salinity, conductivity, underwater radiation from estuaries, C. Aquatic culture ponds/tanks, D. Greenhouses for air temperature, diffused radiation, E. Dam safety-related data from masonry and earthen dams including seepage, total water level, suspended silt, sedimentation, discharge through different penstocks, canals, etc.
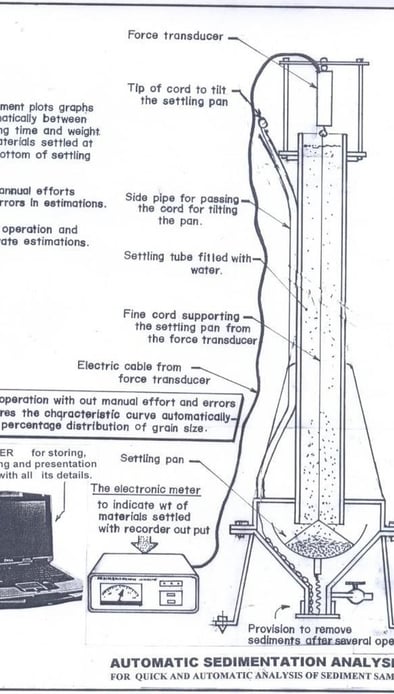
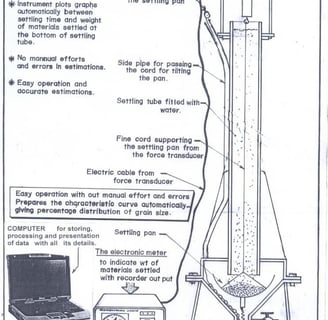
Figure 89: Automatic Sedimentation Analyzer for the automatic analysis of marine sediment samples collected from strategic locations, developed based on a totally new principle of Stokes' Law, inspired by similar work done in the USA. The activities were conducted during service in CSIR-NIO and later introduced to other R&D institutions, namely CUSAT, KUFOS, CIFT, and CMFRI-Mandapam center, etc. The equipment automatically estimates the percentage values of different grain sizes contained in collected marine sediments. The equipment, originally developed at MIT-Massachusetts Institute of Technology, USA, was replicated based on details obtained from Dr. Siddique, who returned from there. Mr. Jayanarayanan of CUSAT and Mr. Paul, a student of KUFOS, used the system extensively and prepared excellent reports on its utility by analyzing hundreds of samples from several locations. Details of the reports are in Annexes S and T.
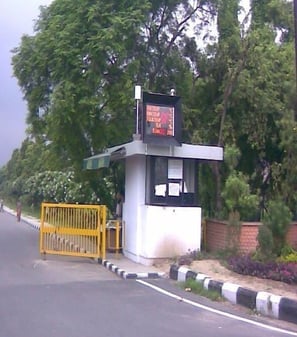
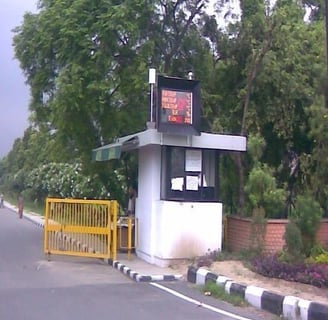
Figures 91 and 92 show two mega displays developed and installed at:
A. CET - College of Engineering, Thiruvananthapuram, and
B. The gate of Ludhiana Agricultural University, as well as many other places including Kashmir-J&K, Goa, etc., based on online data received from their available AWS, for the information of the public and those concerned. Similar cases have been done in many other R&D centers.
It is possible to add other parameters, such as integrated values of energy parameters including solar radiation, wind, ocean waves, etc., for selected durations, etc.