National Training Courses on Indigenous Technology
Conducted at ICAR-CIFT and other strategically important centers.
4/16/202414 min read
Figure 92: Sample case of several national training courses conducted by ICAR-CIFT and sponsored by the Department of Science and Technology - Government of India, to promote R&D activities based on applications of electronics and instrumentation, in 1969. Many such courses were organized in CIFT and also at selected places including IARI-Delhi, WTCs, NIH-Roorkee, KAU-Trichur, CPCRI, KFRI, CWRDM, NHI, etc.
Proceedings of several courses have been prepared with details and participants.
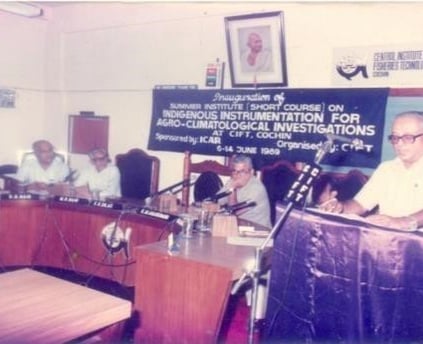
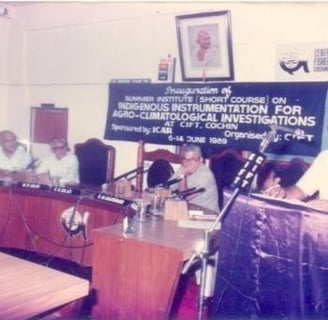
Figure 93: Exhibition of Indigenous Observation Techniques Developed in CIFT. Agricultural Minister Shri V.V. Raghavan is seen visiting the exhibition along with other dignitaries, including Shri Rajendra Nathan Nair, Director of CIFT, and Dr. S.M. Silas, Director of ICAR-CMFRI.
All the national-level training courses were organized to showcase the applications and scope of the indigenous technology initiated in CIFT and later commercialized by EMCON, through NRDC of India, with considerable skill and interest by its management at different times, by Shri T.D. Joshy and later by Shri Sreejith, T.S., who have contributed to many new developments through close contact with numerous end-users.
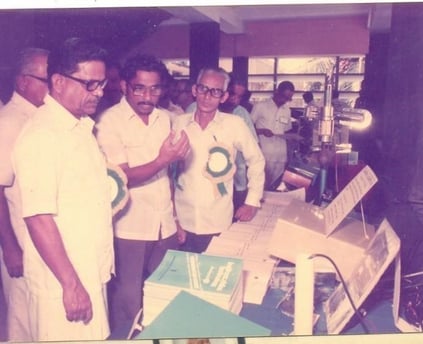
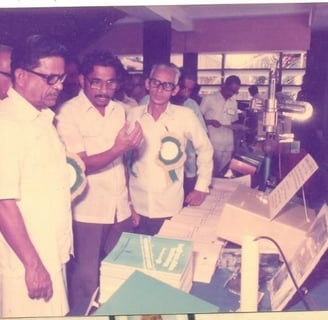
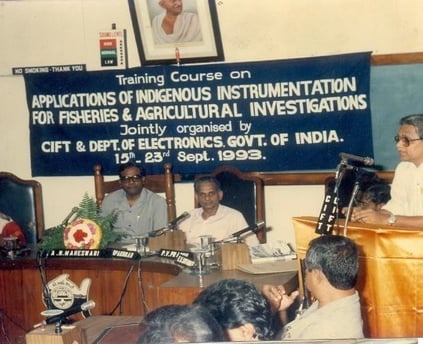
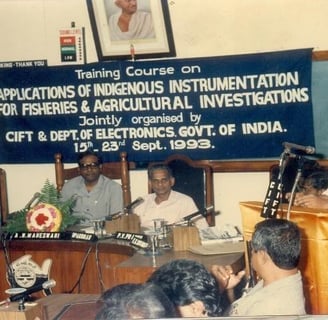
Figure 94: Training Course on Fisheries and Agricultural Investigations, where the inauguration was presided over by Dr. Maheshwary, Vice Chancellor of Kerala Agricultural University (KAU), Thrissur.
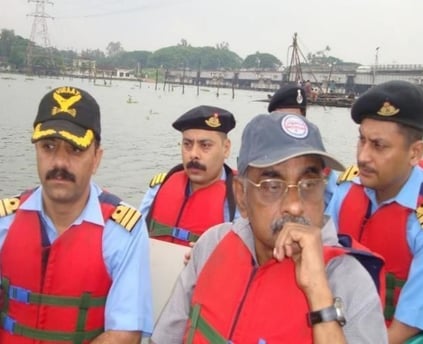
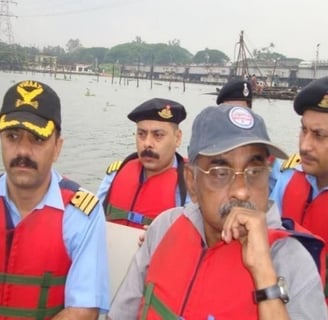
Figure 95: One of the several training courses conducted for the Southern Naval Command (SNOM) of the Indian Navy, to demonstrate the acquisition of marine environmental data from the Cochin backwaters using indigenously developed instruments at CIFT.
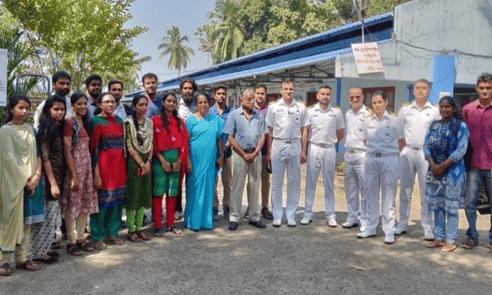
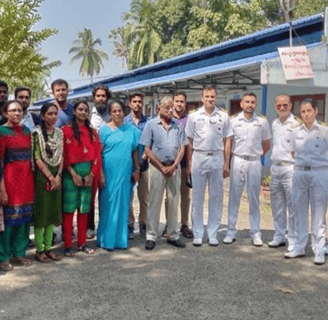
Figure 96: Training course conducted at Kerala University of Fisheries and Ocean Studies (KUFOS), with participants from the Southern Naval Command (SNOM) of the Indian Navy, using indigenous marine environmental measuring instruments.
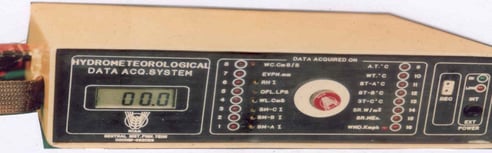
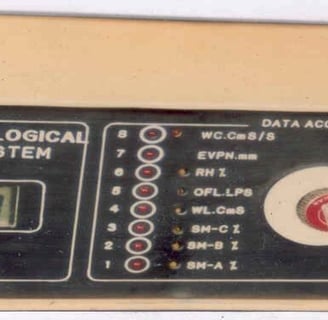
Figure 97: Hydro-Meteorological Data Acquisition System developed at CIFT as a portable unit, designed for easy transportation across the country for demonstrations, as part of the ad-hoc project sponsored by the Agricultural Engineering Department of ICAR-Delhi. Demonstrations were conducted at various institutions including IARI-Delhi, CIFAO, CPCRI, different WTCs, CESS, TNAU, KAU, NIH, CIFA, CASAM, IHH, WTC-TNAU, ERDC-Tvm, RARS-Pilicode, AVVM College, CIAE, NSIE, CACRI, CWRDM, CWPRS, KFRI, and others.
Many related PowerPoint presentations were prepared to facilitate the transparent understanding of its technical features and applications, highlighting the complex and interdisciplinary aspects in nature. This approach aims at promoting justifiable exploitation of natural resources, as opposed to blind belief.
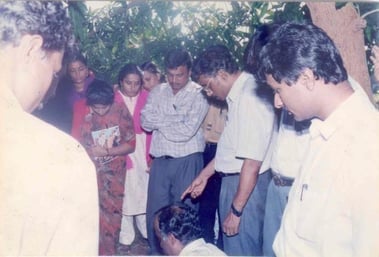
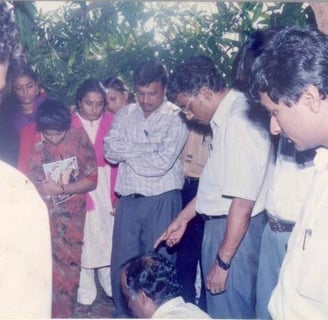
Figure 98: Installation of Soil Moisture Sensor developed at CIFT, which is a crucial parameter in agriculture and practical in several training courses. The detection and correction of errors, identified based on principles following observational techniques and instrumentation, demonstrate that errors committed by large R&D organizations can be identified by adhering to the principles of electronics and instrumentation. Some of these errors could later be corrected, as detailed in Annex U. It has been observed that internationally renowned R&D organizations have made significant mistakes, identified from their various contributions, often due to a lack of seriousness in their commitments and dedication. Numerous recorded examples are available for analysis. These errors are analyzed based on observational techniques prepared in electronics and instrumentation applied to the observation of natural processes, rather than merely limiting their scope to academic values. There are plenty of examples demonstrating how serious mistakes are committed. Some of the basic related points are:
A. The expression of error itself is often incorrectly presented even in scientific publications.
B. Estimations of errors made during the calibration of sensors and
C. Instrumentation systems are incorrectly performed by large, internationally reputed agencies.
Such estimated errors can reach up to 100% and more, as shown in Figure 1
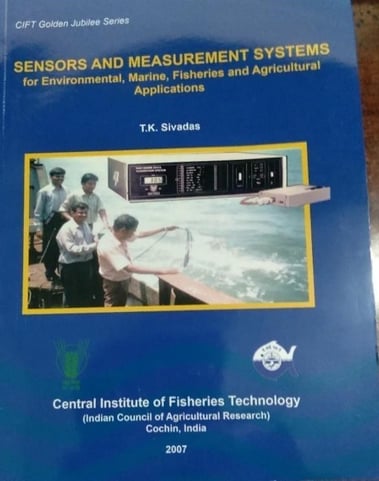
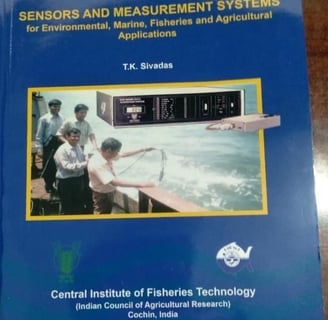
Figure 99: Book on the Novel Applications of New Sensors and Related Observational Techniques developed by the author at CIFT and published in 2007. The book showcases a variety of new case studies on applications not found elsewhere in the country or internationally.
Electronic Instruments with Training Proposed for Dam Safety: Detailed in Annex-V. As part of the activities at the Idukki Dam, the book illustrates how the tilt of the plumbing line is sensed with an accuracy of about 50mm at the top of the dam, using a sensor based on the differential impedance method. The types shown in figures 86 and 87 have been maintained in operational condition continuously in the development lab in Cochin for more than 10-15 years.
Later, the concerned authorities remarked that such sensors and measurement systems were unnecessary, as remote sensing technology had advanced significantly, claiming that minute details in space could be measured with nanometer accuracy. Hence, they suggested that the tilt of the dam could also be measured with such accuracy. The question arises: where are such measurements practiced, with examples? No case of measurements in space was found by the author, with the closest possible technologies being GPS and DGPS. Here, too, experts in specialized areas have sometimes shown a tendency to become uncritical believers, despite having ample access to verify the facts.
Electro-Inductive Differential Sensor Developed for Dam Safety: Based on the tilt of the existing plumbing line in masonry dams, this equipment was not installed in the Idukki Dam, possibly due to its Indian origin. Both types have been kept in operational condition in the EMCON lab for more than 15 and 10 years, respectively.
The reasons why it could not be used in the Idukki Dam remain to be examined, as detailed in Annex-W. Further details of sensors developed for earthen dams are given in Annex-X.
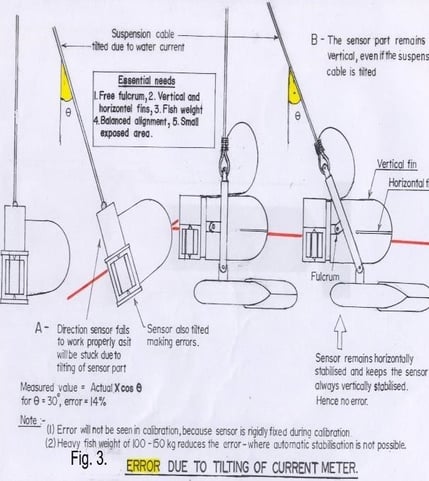
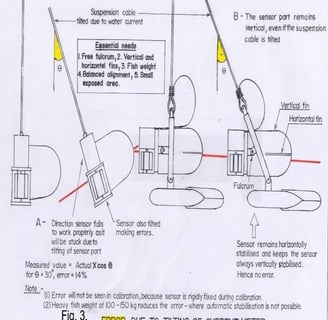
Figure 100: Cosine Angle Error. More than 7,000 water current meters available in India, primarily used by the Central Water Commission (CWC) for river gauging and by others for ocean measurements, suffer from significant errors due to the lack of suitable designs. Often, these points are either ignored or neglected by the concerned parties.
The Significance and Importance of Cosine Angle Error:
This major error persists in water current meters used by several water resources survey agencies. The sensor probes of the current meters tilt along with the suspension cable, while others, positioned correctly, remain stabilized horizontally without incurring a Cosine Angle Error, which is proportional to the cosine of the tilt angle of the suspension.
Special Features:
1. No pressure chamber is needed, as the sensor can withstand high hydrostatic pressures, with cable lengths extending up to several hundred meters.
2. Designs for penstock pipes with a Hydro-dynamic Tilting Lever.
3. Miniature type for use in canals with wading rope applications, as a handheld device.
4. Low impedance with immunity to noise.
5. Low power consumption, requiring only 6V or 12V.
6. Direct reading in cm/sec.
7. Equipped with an LCD display.
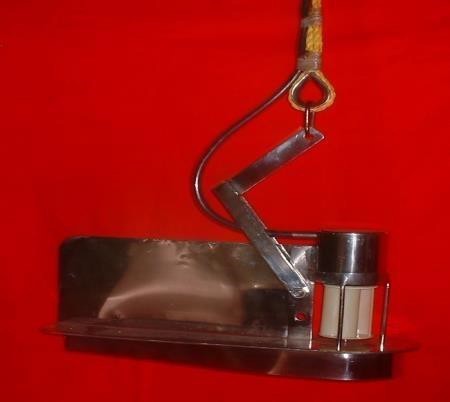
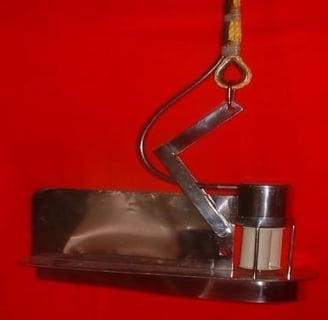
Figure 101: Ocean Current Meter Free from Cosine Angle Error, suitable for measurements both in rivers and oceans, capable of providing both current and direction data, and free from Cosine Angle Error. Developed at CIFT, this device has been calibrated at CWPRS and IITM. The figure highlights the simplicity of the design, which does not require a pressure chamber.
Many other designs for specific applications are available, including micro-size types for model tanks. Despite their small size and low weight, these devices can remain stabilized horizontally under water and provide accurate values free from Cosine Angle Error, a problem that plagues several thousand water current meters in India due to the lack of an automatic stabilization facility.
Examples include the Cosine Angle Error observed during calibrations at CWPRS-Pune and FCRI-Palakkad, which can be interpreted as errors of 100% and above due to incorrect calibration methods. The same flawed method is followed by IMD-Pune for another parameter.
Details are provided in Annex-Y.
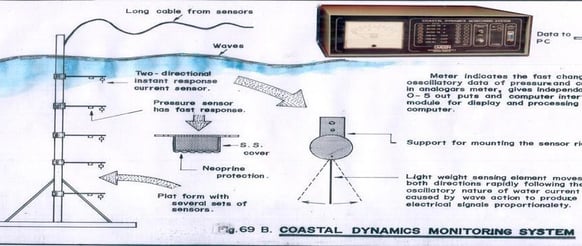
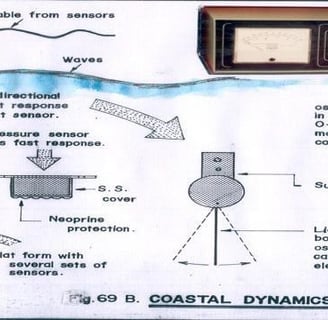
Figure 102: Ocean TeleLab, developed as part of a Ph.D. thesis by the author, for the measurement of five important ocean parameters directly and simultaneously from ocean depths. The figure illustrates this innovative system designed to enhance the efficiency and accuracy of oceanographic data collection
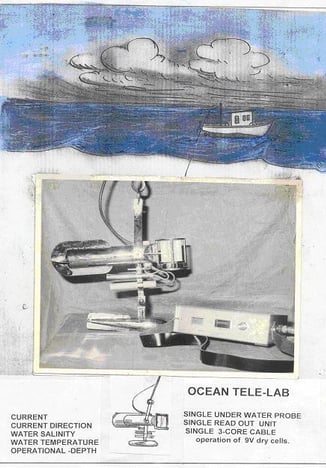
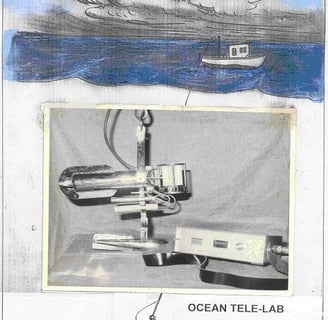
Figure 103: Coastal Dynamics Monitoring System for CUSAT and NPOL, installed in the coastal waters of Alappuzha for studies on the geophysical aspects of Chakara, a unique phenomenon appearing along the Kerala Coast. The system includes specially developed sensors for measuring A) oscillatory water currents caused by wave action and B) wave pressure. A total of 10 sensors (5+5) are mounted on a tower to facilitate these studies.
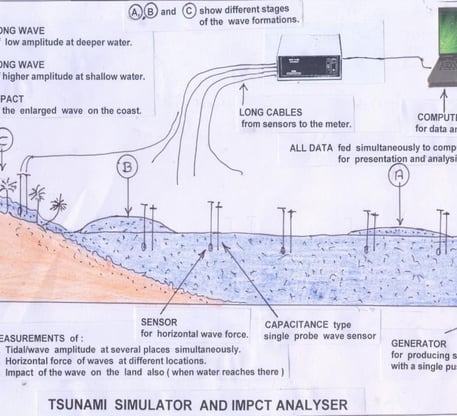
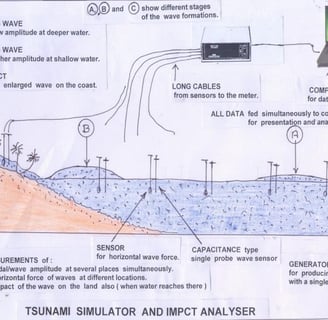
Figure 104: Tsunami Simulator and Impact Analysis. Numerous hydrodynamic model engineering studies have been conducted in various model tanks at institutions such as CWPRS, IITM, NITC, NITK, and FCRI. This figure is based on a new study that can be conducted in the aforementioned model tanks, utilizing newly developed sensors for 1) oscillatory water current, 2) waves, 3) capacitance-type water level sensor, and 4) capacitance-type wave sensor. The setup allows for the generation of waves with different characteristic features, including varying wavelengths and wave periods, as required for the study.
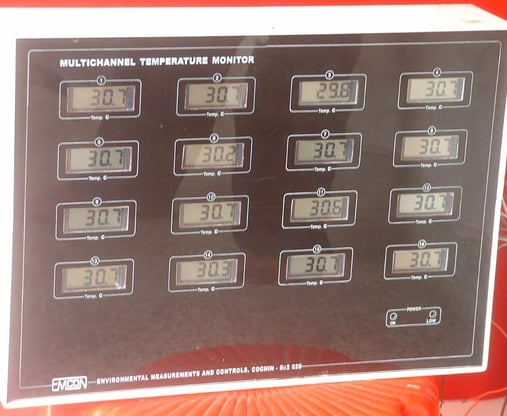
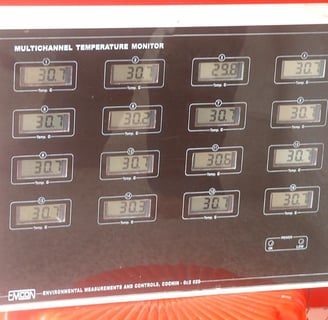
Figure 105: Multi-Channel Temperature Monitoring System developed for Wonderla, Bangalore, for recording the temperature of different pipes at remote locations. Other instruments supplied to Wonderla include a Multi-Channel Temperature Controller and a Hydrometeorological Station.
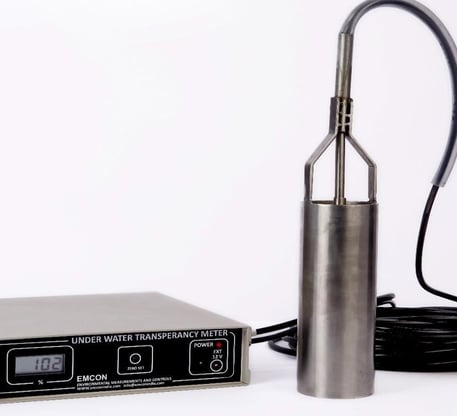
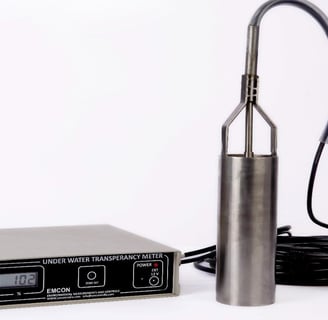
Figure 106: Underwater Transparency Meter developed for Kerala University of Fisheries and Ocean Studies (KUFOS). This device provides instantaneous data from water depths directly, without requiring water sampling.
Some of the pamphlets were prepared by EMCON-Cochin, which began its activities using CIFT technology through the National Research Development Corporation (NRDC) of India. Later, they expanded their offerings to meet the specific needs of numerous customers. This included observation and exploration at remote locations such as ocean depths and agricultural studies, among many other areas mentioned on page 4. These efforts were under the technical guidance of T.K. Sivadas and managed through a series of large implementations carried out by Shri Sreejith, T.S., as the Managing Director of the firm EMCON.
Figure 107: Land Slide Sensor developed to sense and detect shakes, displacements, including large vibrations of soil due to various geological reasons such as landslides during earthquakes, heavy rain, etc. The sensor is passive, and its range can be adjusted from one meter to a few meters as needed. It is linear and flexible, equipped with two hooks at both ends for mounting. The sensor is installed at the required location using two 2-foot poles stuck into loose soil. In cases of strong rocky soil, it may be fixed suitably to ensure stability and effectiveness in monitoring.
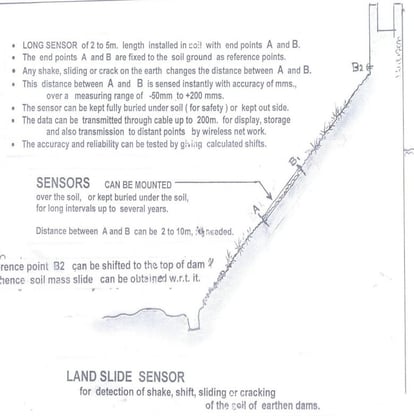
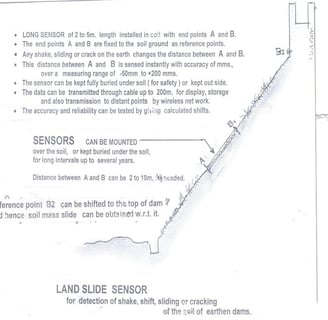
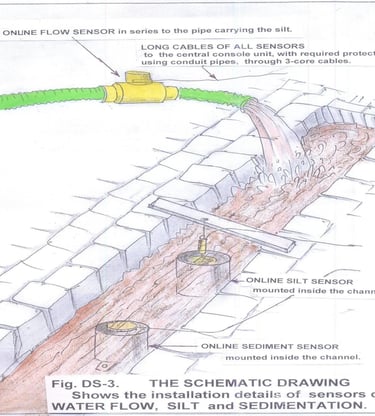
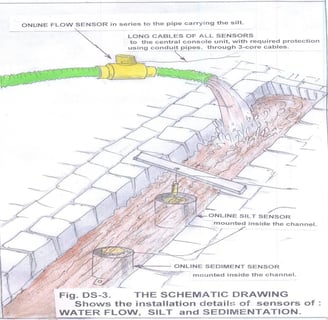
Figure 108: Recording of Silt and Sediments from the existing discharge pipe of the Kanjirapuzha Earthen Dam.
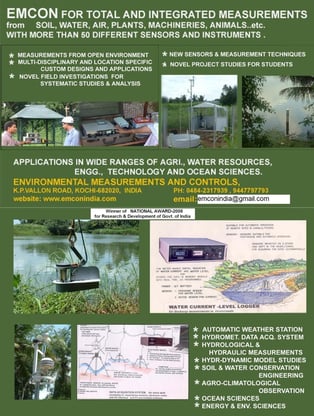
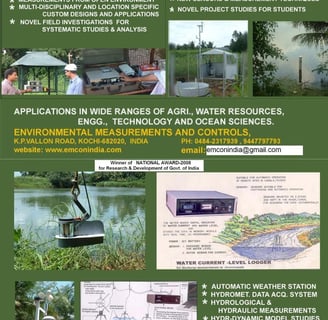
Figure 109: Pamphlet of EMCON, one of the commercial firms that acquired know-how from CIFT through NRDC of India and initiated R&D activities, supplying to more than 700 R&D institutions.
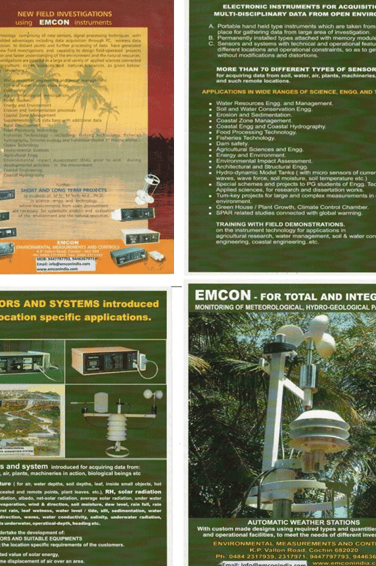
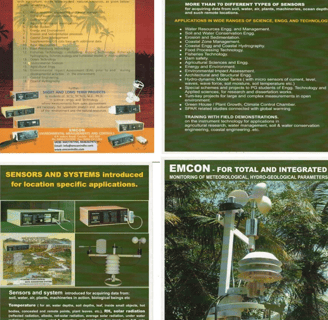
Figure 110: Pamphlet of EMCON, showcasing different activities.
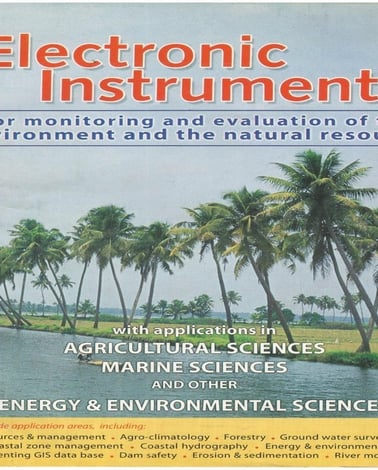
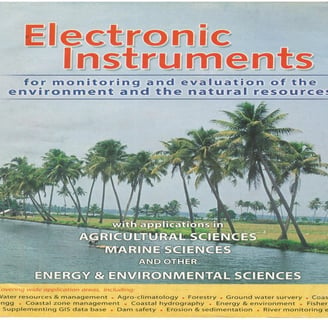
Fig. 111. PAMPHLET OF EMCON showing numerous observation systems, based on Electronics and Instrumentation.
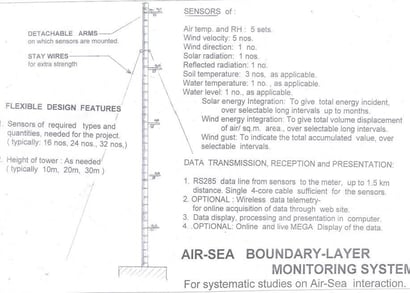
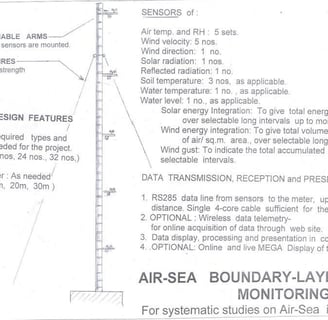
Figure 112: The Air-Sea Boundary Layer Monitoring System is ideal for implementation in R&D and related survey departments involved in investigations. This is a modified design that adds more information on the subject. Many related departments were contacted with no response. There are more than 400 such illustrated cases developed under different applied areas, prepared to show the applications made, along with more than two dozen PowerPoint presentations. These presentations are prepared to describe the applications, including new investigations and experiments made possible using the sensors and observation techniques developed.
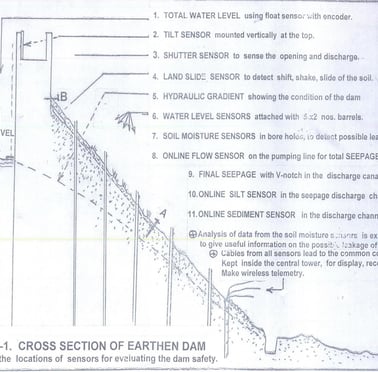
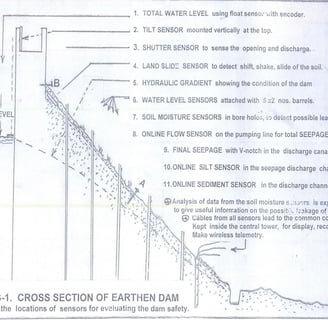
Figure 113: Structure of the Kanjirapuzha Earthen Dam in Palakkad District. Many designs were prepared to implement matching instruments for monitoring safety-related operational features, including: A. Water seepage based on continuous measurements of soil moisture. B. Landslide. C. Estimation of hydraulic gradient. D. Estimation of total seepage water. E. Estimation of total silt content in seepage water. F. Measurement of total water level inside the dam. G. Final tilt of the concrete part of the dam using a tilt sensor.
Figure 114: Discharge-Silt-Water Level Estimation Process for discharge water from dams, canals, etc., using sensors for A. Overflow sensor for discharge of V-Notch weir following its hydraulic relation, B. Silt Sensor, C. Water Level Sensor.
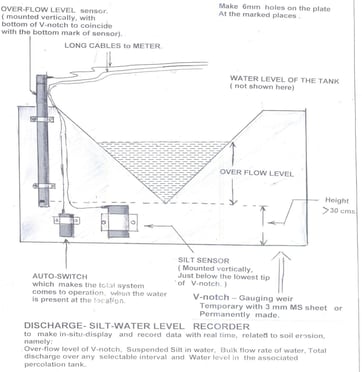
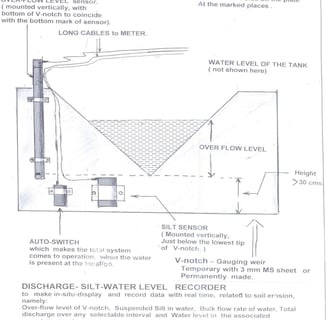
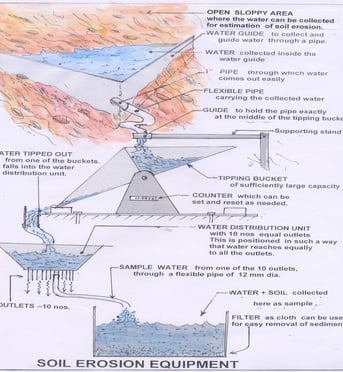
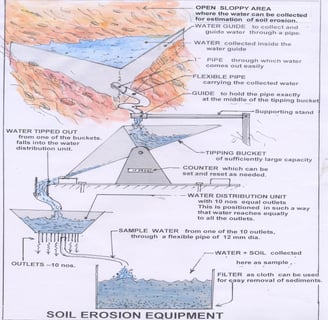
Figure 115: Soil Erosion Equipment designed for use during the discharge of water, utilizing sensors of A. Tipping Bucket type water discharge sensor, B. Water filtering facility.
Figure 116: Cross Section of the Earthen Dam, Kanjirapuzha, in Palakkad District. This was taken as a sample case for analysis as part of Dam Safety by the Irrigation-Design-Research-Board (IDRB). Expert members visited the dam and examined its operational features.
The drawing was prepared by Dr. T.K. Sivadas, and many important sensors were developed, including:
A. Dam Tilt Sensor (No.2 above) for the continuous estimation of tilt as the important damaging effect.
The Dam Tilt sensor (Figure 116) has been kept working in my lab in Cochin for more than 15 years.
The Pluming Line Tilt sensor developed for the Idukki Dam (Figure XX) is also kept in working condition in my lab.
Both pieces of equipment, as per the NEWGEN concept, were discussed in several related meetings and then simply forgotten.
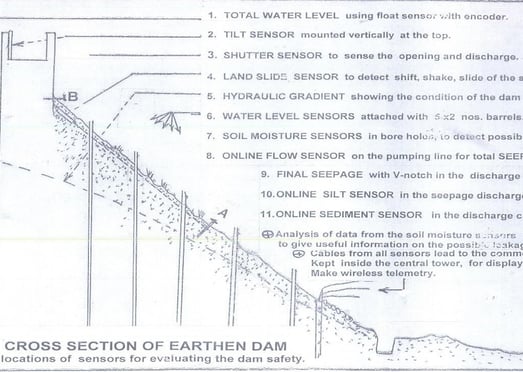
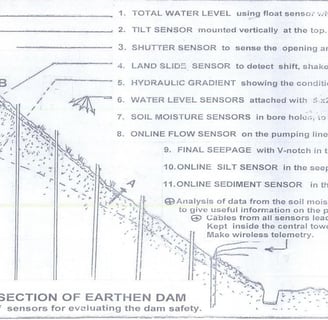
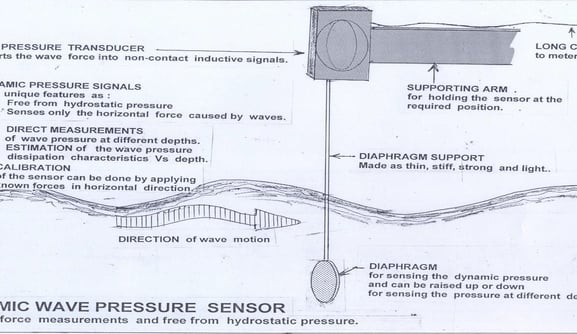
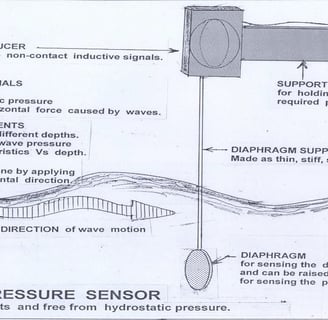
Figure 117: Hydrodynamic Wave Force Sensor Developed for the testing and measurement of horizontal wave force acting on a diaphragm, free from hydrostatic pressure. A series of such sensors have been developed for R&D activities connected with various applications.
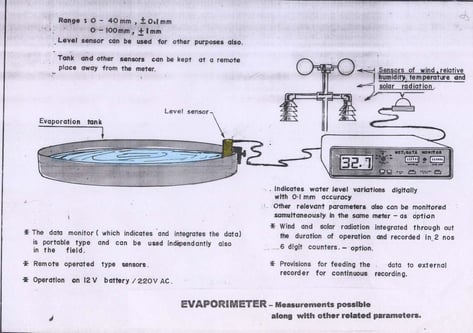
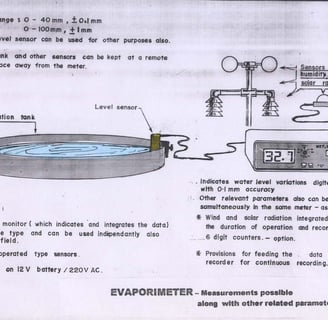
Figure 118: Conventional Type Evaporation Pan, enhanced with related meteorological parameters of relative humidity (RH), air temperature (AT), and wind, enabling easier and better analysis.
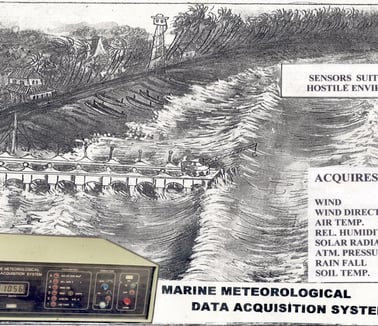
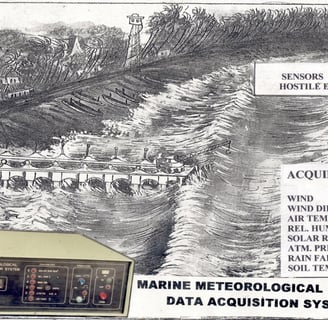
Figure 119: Marine Meteorological Data Acquisition System Developed for related meteorological investigations. These investigations are enhanced by adding, preferably, more matching data available from other instruments.
Figure 120: Memory Ocean Current Meter, developed to meet the special requirements of the Geological Survey of India, which insisted on having a memory module embedded. This was because the automatic operation of ocean current measurements in areas like Madras, Cochin, and Calcutta required such a facility. Details are provided in Annex-ZB.
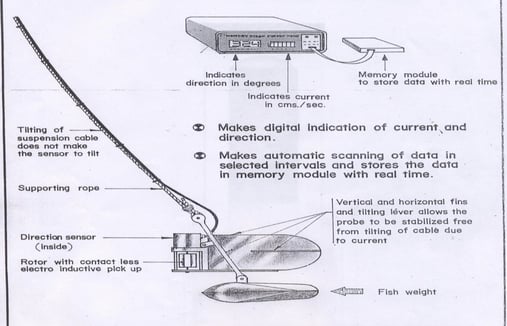
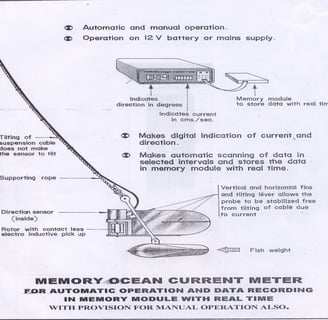
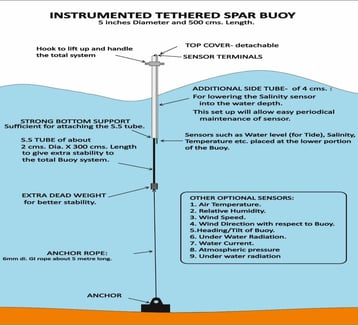
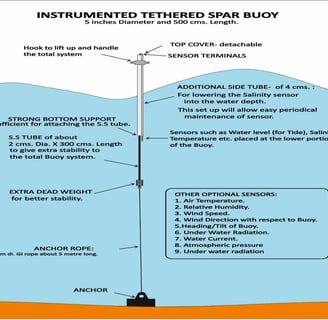
Figure 121: Instrumented Data Buoy was designed with indigenously developed sensors and presented at the request of the National Institute of Oceanography (NIO) director, Dr. Shettia, around 2006. Unlike conventional buoys, this design allows for easy fabrication and incorporates more useful sensors, totaling 9 as mentioned in the figure. The presentation at NIO was highly appreciated by the director. Unfortunately, it has not been implemented, typical of the NewGen style, where ambitious actions are proposed but not implemented.
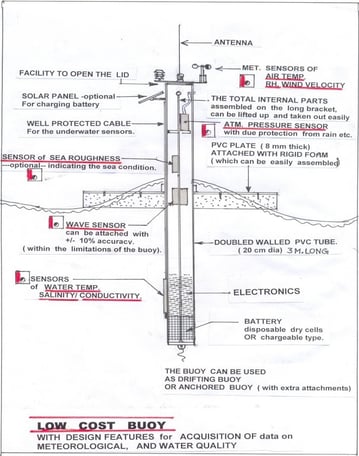
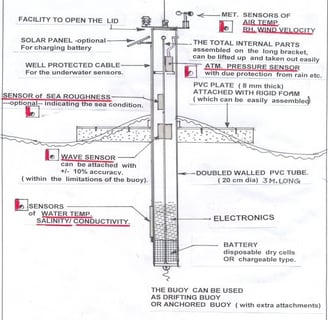
Figure 122: Low-cost buoy designed for easy fabrication with indigenous materials and also meeting all needs, with more useful sensors. We have no indigenous buoy stem so far. I propose that those interested take up this design. I am prepared to give all technical help and guidance.
+Expression of error and its incorrect estimation, as followed, is presented in important documents, even by large organizations, during the preparation of calibration certificates. This occurs despite reminders of the mistakes, identified by the principles of sensors and observational systems.
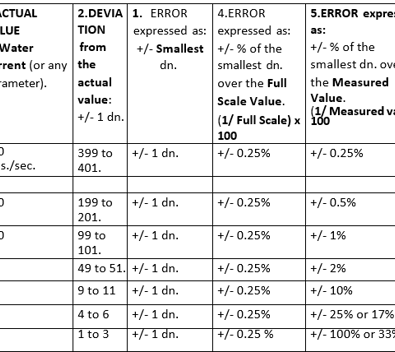
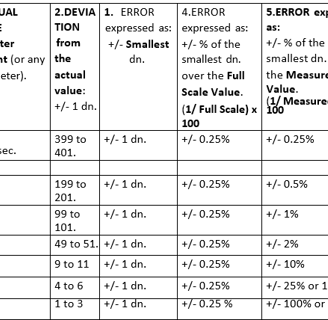
Figure 123: Examples of errors that can be expressed and also shows the real one, which is practical. Many large R&D institutions express errors the wrong way, unknowingly using a senseless method. For example, a water current meter. Here, the values given are only arbitrary examples matching a high-quality current meter with a deviation of +/- 1 cm./sec. only. Even in such a case, it shows a high error in Column 5, which exceeded values even beyond 100%, when the error is estimated based on measured values, found to be baseless and repeatedly followed by many large firms. This basic mistake could be exposed by following the principles, and some agencies could be made to correct it. Details in Annex-Z.
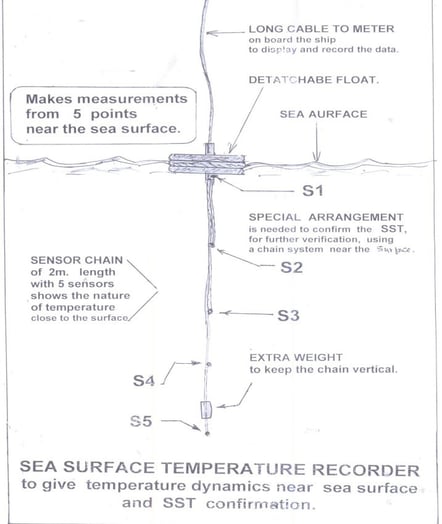
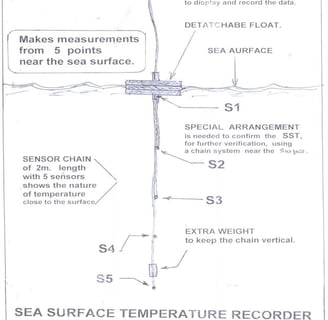
Figure 124: SST-N Temperature Measurements taken continuously from several depths near the surface and displayed in a Data Logger.
Testing and Calibration of Sensors and Instruments: Wherever facilities were available, the sensors and instruments were calibrated at CWPRS-Pune, IMD-Pune, FCRI-Palghat, STIC-Cochin, IITM-Chennai, NPL-Delhi, and the NPOL-Test facility at Idukki reservoir. Details with test and calibration certificates are in Annex-ZA.
The result of large projects that yield unhealthy outcomes without any positive effects, following the NewGen technique which is to be implemented, has become a topic of concern. The NewGen technique has gained popularity due to its simplicity, easy accessibility, no effort, and no expenditure, among other factors. Here are some examples from my experience:
A. Dam Safety: The IDRB project on Kanjirappuzha Dam, with details provided in Annex ZC.
B. Dam Safety Project of Idukki Dam: Details in Annex ZD. This includes many small cases such as the CUSAT-PO on Instrumentation for effective analysis.
C. Practical applications generally fail. The reasons for this need to be examined in detail, as outlined in Annex ZE. Further details of the matter will be provided upon request.
Additionally, a few selected topics are available for further analysis and exploration:
A. Value addition in higher education in many prime areas with newly generated relevant field applications, as a new field of investigations and experiments.
B. Studies on the hydrodynamic performance evaluation of otter trawl systems through sensors and electronics & instrumentation.
C. Scope for large field applications through electronics and instrumentation in the prime areas, relevant to natural processes.
D. Large field-operated electronic infrastructural facilities in prime applied areas, under engineering, technology, and applied sciences.
E. Major errors repeatedly committed by large reputed organizations due to a lack of basic concepts in observational techniques.
F. The need and scope of systematic analysis of natural systems leading to their sustainable exploitation and management.
G. The need and scope of “live operational systems in educational and R&D organizations”, along with live data acquired from soil, water, plants, buildings, and other structures.
H. Technological growth of applied sciences, supported with the development of sensors, electronics, testing & calibration of the measurement tools, technology transfer, training, and providing required technical support to different prime applied areas.
I. The technology is applicable to many natural processes, including agricultural sciences, architectural & structural engineering, ocean sciences, coastal & harbor engineering, dam safety & its hydrometeorological environment, IRDB--irrigation research & design systems, etc.
J. The new lazy concepts in higher education are causing a regression from progress.
K. Totally new technology including sensors, signal processors, EIP- Energy Integration Processors, leading to new applications as investigations and experiments in open nature.
L. How the new R&D activities in Electronics & Instrumentation were started, resulting in more than 700 illustrated figures, one dozen PPTs, etc.