Energy Integration Process (ENP): Its Significance and Applications
4/16/202411 min read
The Energy Integration Process (ENP) represents a groundbreaking development in the field of energy analysis. Designed to be universally applicable across a wide range of energy parameters found in nature, ENP facilitates comprehensive assessments of various energy sources, including:
- Solar radiation and its components
- Average radiation in the shades of canopies
- Wind velocity and gusts
- Infrared radiation
- Ultraviolet radiation
- Sea Surface Temperature (SST)
- Ocean waves
- Tides, and more
ENP's advanced algorithms enable the automatic estimation of the total energy available from each parameter over selected periods ranging from hours to days, and even extending up to years. This process ensures a detailed and accurate understanding of energy availability, crucial for efficient energy management and sustainability efforts.
For more detailed information, refer to Annex-M.
Figure 40: Soil moisture sensors developed enable many novel applications, including A. the detection and estimation of soil moisture variations around different plant roots, helping to estimate the water intake needs of different types of trees and many similar estimations.
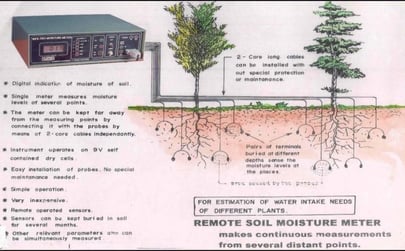
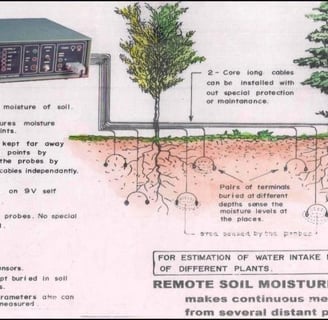
The soil moisture sensors developed based on the electro-inductive principle feature numerous technical, operational advantages, and innovative applications, including the detection of water leakage in earthen dams among others.
The key attributes of these sensors include:
1. Uniform signal characteristics and consistent performance across all sensors.
2. Low impedance, providing high immunity to electrical noise, which enhances reliability and accuracy.
3. Compatibility with a single data logger for multiple sensors, optimizing efficiency and reducing equipment costs.
4. The ability to easily check for location-specific features at the site, enabling the detection of errors that may arise from the presence of other conductive materials in the soil.
5. The use of standard electrical cables for the sensors, simplifying installation and maintenance requirements.
Figure 41: Photograph of a soil moisture sensor with low impedance, attached to a long cable that has a remote operation facility. This enables centralized measurements from different locations.
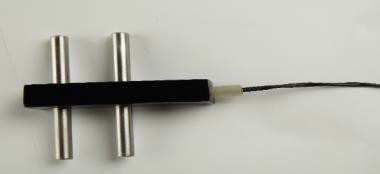
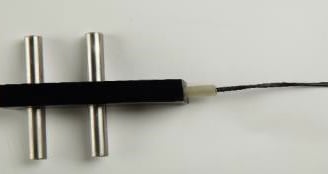
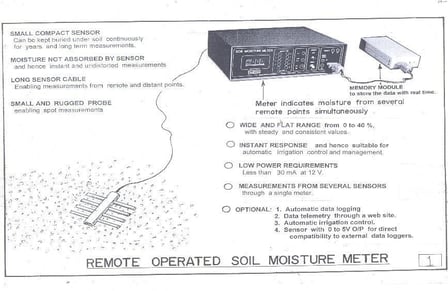
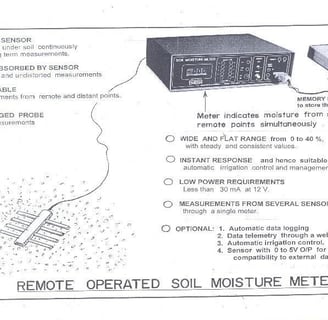
Figure 42: Soil moisture sensors are used to make continuous measurements in large areas, with data simultaneously fed to a data logger up to more than 500 meters, or to make wireless transmission via GPRS or IoT to unlimited locations.
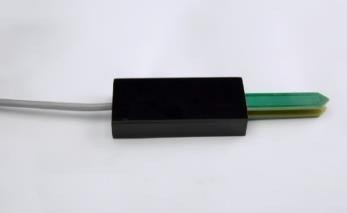
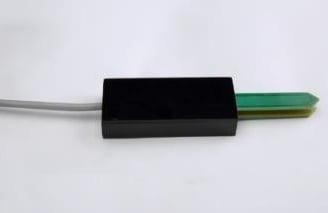
Figure 43: Capacitance type sensor for soil moisture developed is free from the adverse influence of high-level electrically conducting materials present in soils, in the country around less than 20% of the total area. Examples include the Kuttanad area due to the tidal effect of saline water entering the area, and some places in Gujarat, Tamil Nadu, etc.
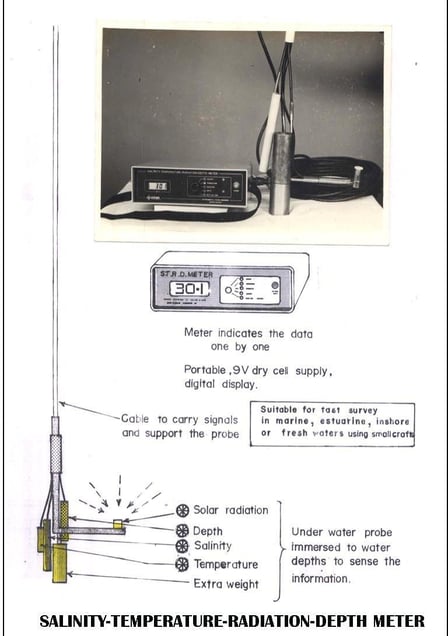
Figure 44: STRD (Salinity-Temperature-Radiation-Depth) Meter is designed to conduct fast surveys of lakes and backwaters. It has already been used in Chilka Lagoon, Vembanad backwaters, etc., as part of different projects. All the related parameters are obtained simultaneously, without requiring any sample collection.
Measurements of all the important coastal oceanographic parameters, suitable for shallow depths up to 200 meters, have been implemented in various related research and development (R&D) laboratories. These include notable locations such as the Chilka Lagoon in Orissa and the Kalyani Lake in Kolkata, among others.
Different models of these measurement systems are also available for installation on board research vessels. These systems are designed for the simultaneous measurement of crucial coastal oceanographic parameters, accommodating depths of up to 200 meters. The implementation of these models extends across various R&D laboratories located in places like Orissa and Kolkata. Additionally, other models have been specifically developed for installation on research vessels, facilitating comprehensive oceanographic research in coastal regions.
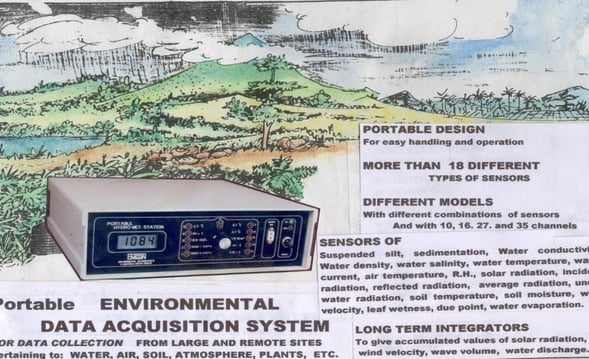
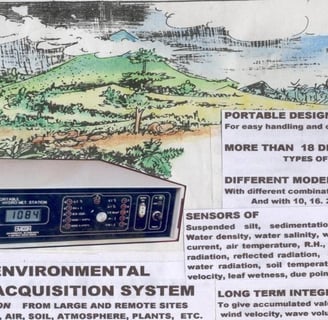
Figure 45: Portable EDAS (Environmental Data Acquisition System) was developed with different designs for acquiring plenty of environmental data from soil, water, plants, atmosphere, etc.
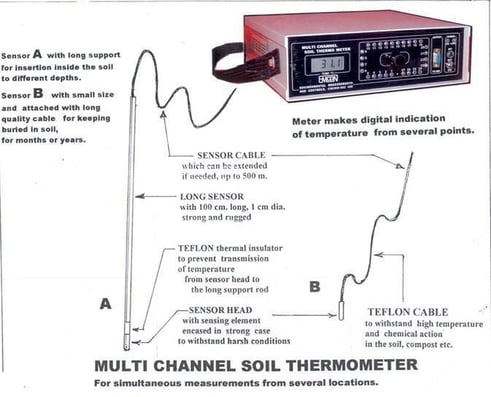
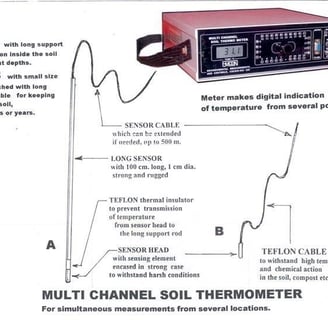
Figure 46: Multichannel Soil Thermometer developed for measurements from different depths and locations including soil mass, compost, etc., without disturbing their normal temperature development pattern. The long supporting stem allows the sensor to sense data without disturbing the soil/compost mass.
Automatic Weather Stations (AWS) and Hydrometeorological Data Acquisition Systems are advanced tools designed for the display and recording of weather and related hydrological data. These systems are integral for a wide range of applications, from climate research to agriculture, offering precise and real-time environmental monitoring.
Data Display and Recording Features:
- Data Display: Utilizes a digital LCD for clear and immediate visualization of data.
- Data Recording: Options include storage in a memory module or direct input into a computer.
- Software: Comprehensive software is provided for the processing and presentation of the recorded data, enhancing the utility and accessibility of the information.
AWS Models:
AWS are available in various models that not only measure standard parameters but also include additional features for a more integrated analysis. These models may feature mega displays or running displays for selected parameters, offering enhanced operational facilities.
Standard and Additional Parameters:
1. Usual Parameters: Wind speed, wind direction, solar radiation, air temperature, relative humidity, rainfall, and water evaporation.
2. Additional Parameters: Include air volume displacement (wind integration), wind gust, accumulated radiation (solar radiation integration), sunshine duration (with 1-minute accuracy), reflected radiation, average radiation (with a sensor chain of 5 sensors), soil temperature, rainfall intensity with bar graph, first rain with real-time tracking, dew level intensity with real-time tracking, soil moisture, leaf wetness, leaf temperature, leaf thickness, and soil conductivity.
Parameters from Nearby Water Sources:
Measurements also extend to nearby water sources, capturing data on water level, temperature, underwater radiation, water flow, bulk flow rate, salinity, and conductivity in nearby wells, canals, etc.
Optional Facilities:
Users can customize their AWS with optional features to meet specific research needs, including:
- Additional sensors for more detailed investigations.
- Data recording in a memory module with an RS232 port for downloading to a PC.
- PC interface for direct data feeding to computers.
- Solar panels for battery charging at remote stations.
- Wireless data telemetry for web-based data availability, leveraging GPRS and IoT technologies.
These comprehensive AWS and Hydrometeorological Data Acquisition Systems are pivotal in providing detailed environmental data critical for informed decision-making and research across various sectors.
Figure 47: Solar Operated Weather Station developed and installed at Tamil Nadu Agricultural University (TNAU). Several such units have been installed at many remote locations.
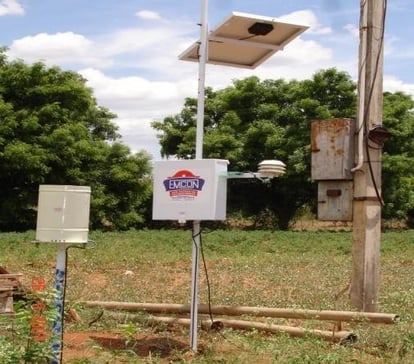
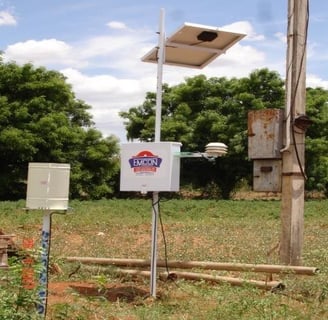
Figure 48: Photographs of some electronic instruments developed and implemented with location-specific applications.
Figure 49: Flow and Discharge System for Canals and Small Rivers, installed by the Kerala State Electricity Board (KSEB) at the Western Ghats and other suitable locations where a gauge well can be constructed for this purpose. The recorded data provide:
A. Bulk flow rate – measured in liters, following the relation given in the figure.
B. Total discharge – determined using an overflow level sensor for the measurements.
C. Based on the well-established hydraulic equation, giving the flow and discharge of water passed through a gauging weir.
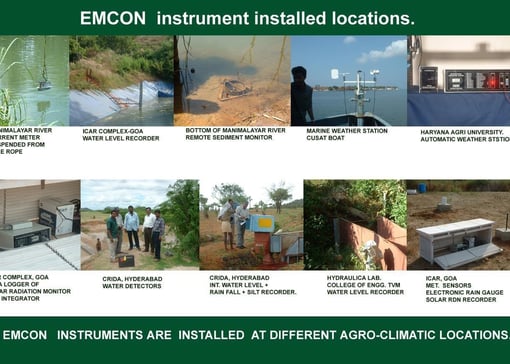
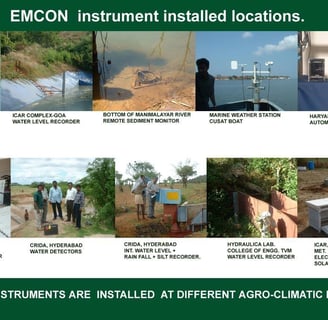
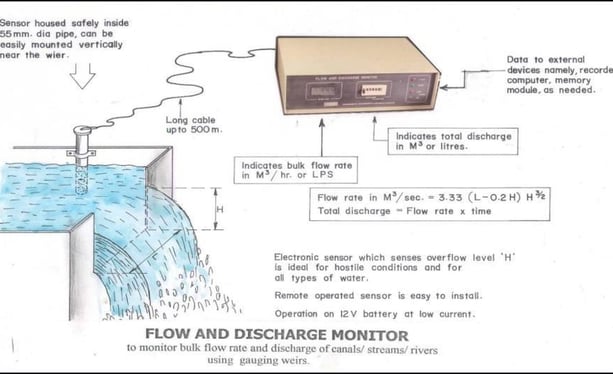
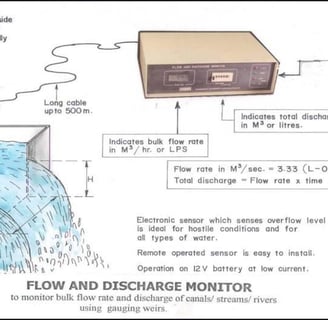
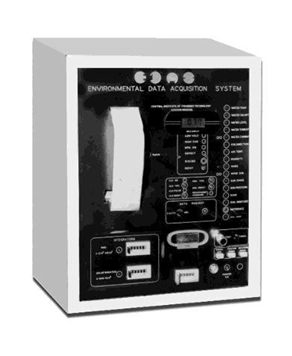
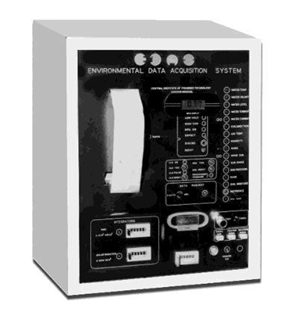
Figure 50: EDAS (Environmental Data Acquisition System) developed for the acquisition of data from different operational locations, featuring facilities for data display, built-in printing of data, data feeding to external devices, and a built-in counter for counting the integrated data. It offers plenty of operational designs to meet location-specific features. The system includes a data integration facility for energy parameters like wind, solar radiation and its components, PAR value, ocean waves, etc., for long selected intervals, continuously up to several years.

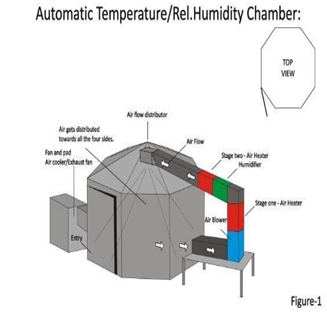
Figure 51: Shows an Environmental Test Chamber with its control panel, developed and installed at Tamil Nadu Agricultural University (TNAU), Coimbatore, for conducting agricultural practices in a controlled and simulated environment with air temperature (AT), relative humidity (RH), and CO2, in the present context of global warming.
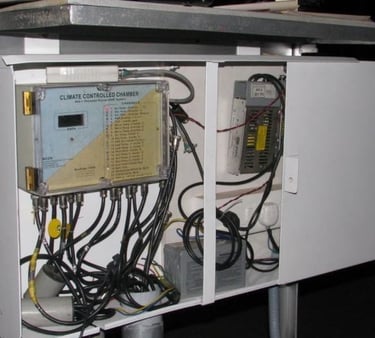
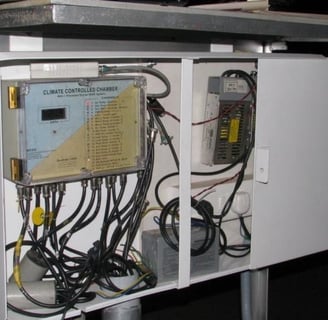
Figure 52: Control Panel of the Climate Control Chamber, featuring several sensors developed for Tamil Nadu Agricultural University (TNAU), Coimbatore, for studies on agricultural practices within a simulated environment in the context of global temperature rise, including air temperature, relative humidity (RH), and CO2. Many investigations can be conducted in a controlled atmosphere with matching type sensors for the works.
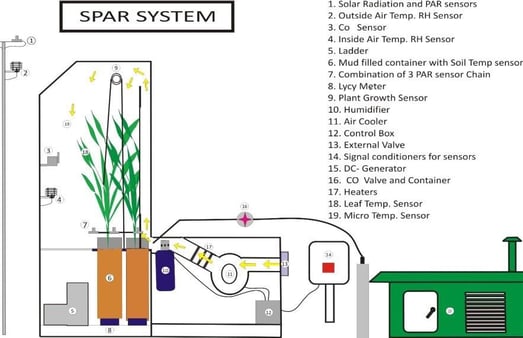
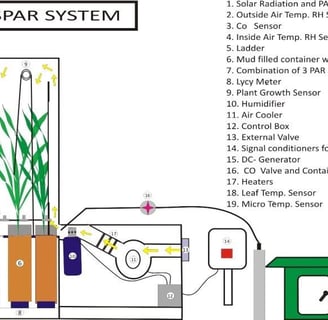
Figure 53: SPAR System developed for Tamil Nadu Agricultural University (TNAU), Coimbatore, for conducting experiments under a simulated environment, in the context of global warming.
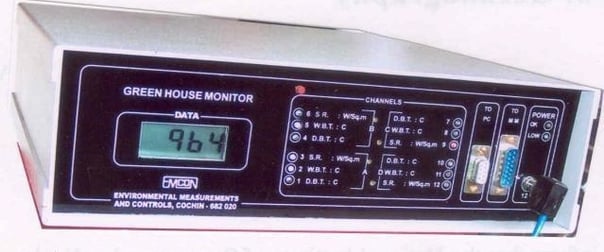
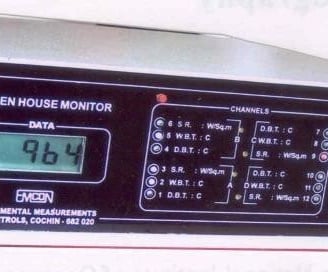
Figure 54: Greenhouse Monitor developed for investigations on spices cultivation in a controlled atmosphere, specifically for the Cardamom Research Center, Spices Board. This system enables a plethora of investigations based on different atmospheric conditions.
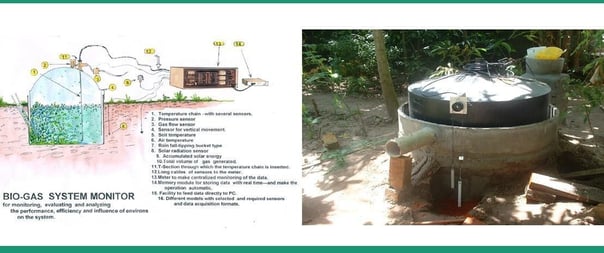
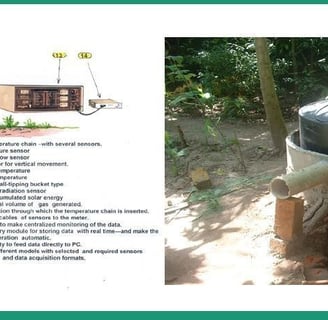
Figure 55: Biogas System Monitor developed and implemented for the Physics Department of Kerala University, to expose the operational functions of biogas systems in physical terms, rather than being analyzed biologically.
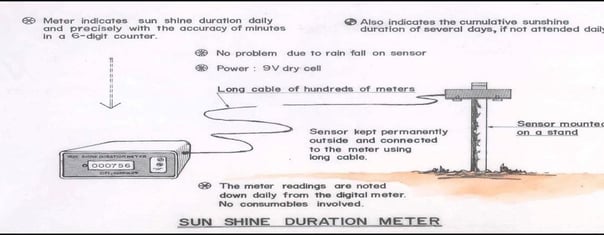
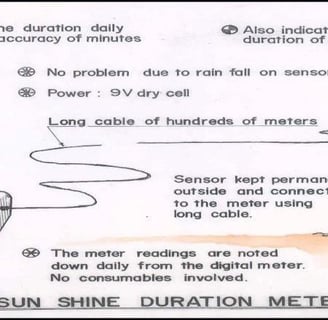
Figure 56: SSD (Sunshine Duration) Meter developed as a totally new method and facility for the continuous acquisition of SSD, popularly needed in atmospheric measurements. It offers many advantages over conventional methods, including being maintenance-free and not requiring personal attention.
The solar radiation sensor is permanently installed, exposed to solar radiation:
1. The data counter is kept inside the laboratory, connected by a long cable.
2. It also provides total energy data over long durations, up to years, including Sunshine Duration (SSD).
3. The counter displays continuous data with minute accuracy.
4. Data can be fed to solid-state data storage units.
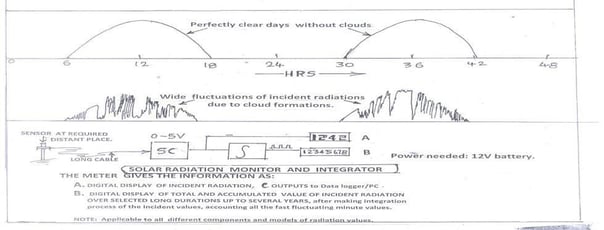
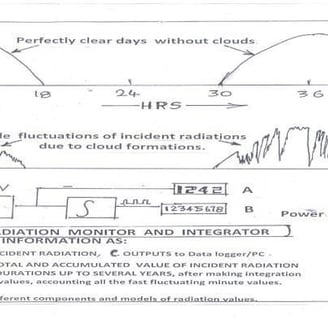
Figure 57: Typical Nature of Solar Radiation Data Recorded for Many Days, continuously in graphical format, based on the EIP - Energy Integration Process. This process can be extended to long durations, up to years, with real-time. Also, in equivalent digital values in real-time, from which the respective values for any hours, days, months, years, etc., can be obtained.
A. Daily Sunshine Duration (SSD) values.
B. Total digital values for any selectable duration up to days/months, from which values of any duration can be obtained for years, without requiring any manual efforts and also free from rainfall interference.
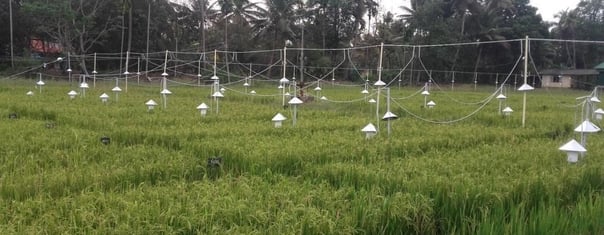
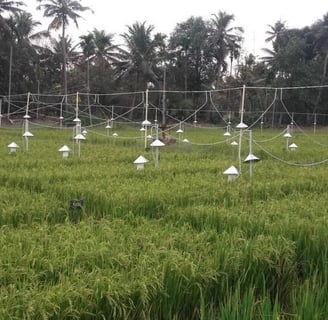
Figure 58: Twenty AWS (Automatic Weather Stations) developed and implemented in paddy fields at KAU-Monkombu, Kottayam District, for investigations in disease forecasting studies in paddy cultivation.
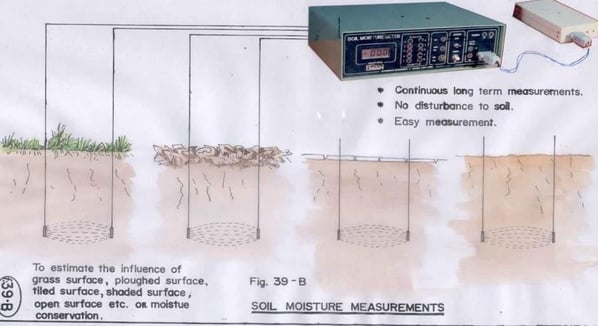
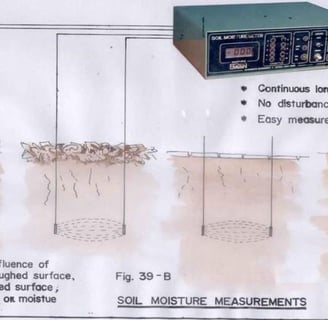
Figure 59: Experimental setup to prove the hidden facts behind the issue of water evaporation from different soil tops, such as from: A. Grassy top, B. Ploughed top, C. Tiled top, and D. Open top. These are basic issues/disputes which still remain controversial among experts. Many such basic issues in open nature can be solved, and the real truth can be established with the help of the discipline “Electronics and Instrumentation.”
Figure 60: Greenhouse Monitors with different design features, complete with various sensors and data loggers, developed for conducting numerous novel experiments. These were developed for the Navsari Agricultural University (NAU).
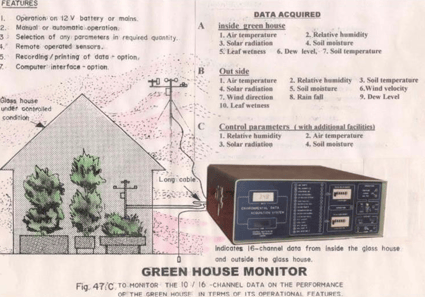
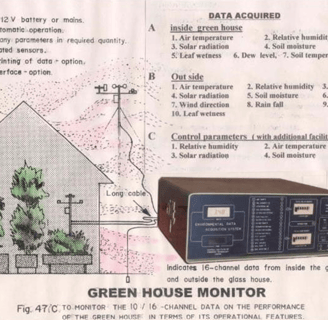
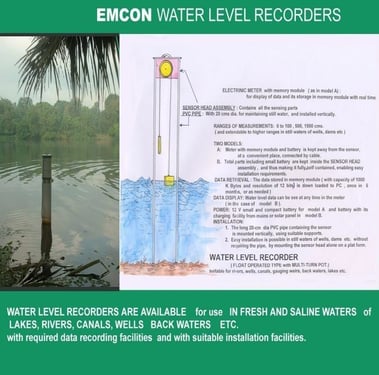
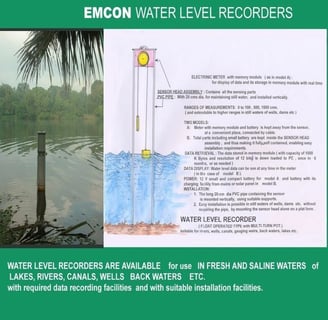
Figure 61: Water Level Recorders developed under primary standards and free from errors due to atmospheric pressure variations. Several recorders were initially developed for CSIR-NIO and installed throughout the Kerala coast as part of a large project undertaken and sponsored by the Department of Ocean Development. The project aimed to estimate the impact of tides on the interior estuaries at different parts, with 10 units installed at various selected locations.
Figure 62: Large Tilting Tank Experimental Setup made in CW&RTI, Bellary, Karnataka, to estimate water intake and distribution and its operational parameters, including:
A. Input water,
B. Water level at different six locations of the long tank,
C. Water infiltrated into the soil depths,
D. Water seeped out through the total soil mass,
E. Water collected below,
F. Balance water came out after the experiment.
Plenty of investigations/experiments were conducted both in controlled conditions and in the open environment, to estimate the water distribution and water intake requirements of soils, plants, etc.
Many new investigations/experiments have been conducted, and many experiments related to soil and water in agriculture are ongoing, by simultaneously recording 26 operational parameters.
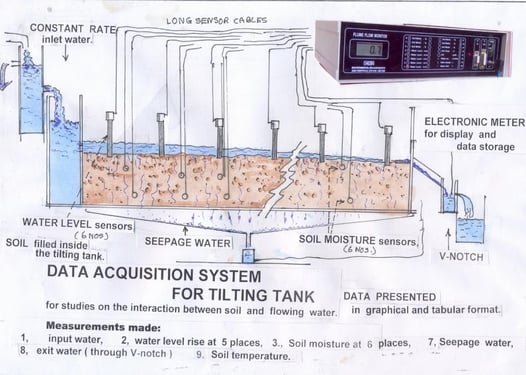

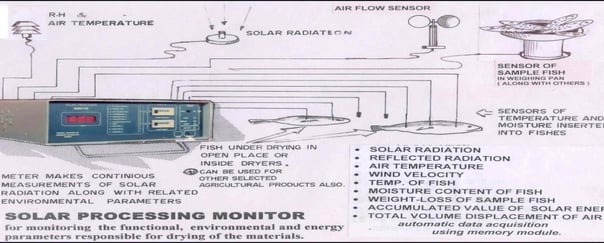
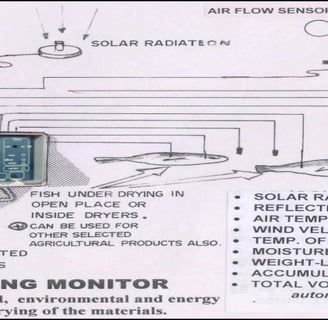
Figure 63: SPM (Solar Processing Monitor) developed and implemented in a few R&D institutions connected with the utilization of solar energy for the dehydration of fish and other agricultural produce. The equipment consists of 10 basic parameters plus integrated values of solar radiation and wind velocity, to give their effective values over any selected intervals automatically up to years. It provides integrated values of the equipment, which was supplied directly from ICAR-CIFT to processing centers in Jadavpur University upon the request from Dr. A.N. Bose, VC of the university and earlier director of CIFT.
Development of sensors and technology for applications in post-harvest technology, behavior studies of marine animals, and fisheries hydrography, etc., are reported with illustrated figures, and details for related research activities are in the book published by CIFT in 2007, written by T.K. Sivadas. Details in Annex-M.
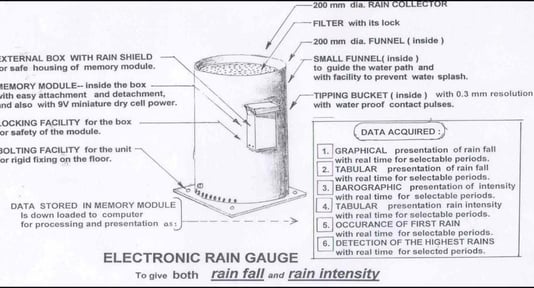
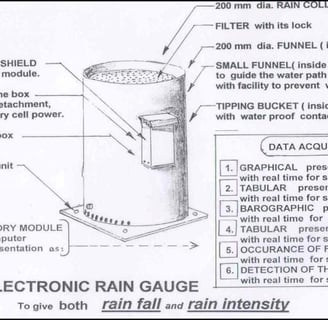
Figure 64: Electronic Rain Gauge equipped with many extra features for enhanced performance, including a built-in data logger, graphical and tabular presentation of data, continuous operation, and other features as stated in the figure. The Rain Gauge Systems were further modified to include a wireless data telemetering facility for the transmission and reception of data in real-time. Many extra facilities for better analysis of rain data are detailed in Fig. 66.
Figure 65: Detailed analysis of rainfall data with graphical and corresponding barographic presentations done automatically.
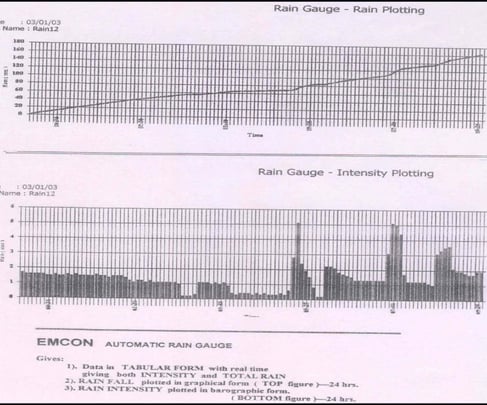
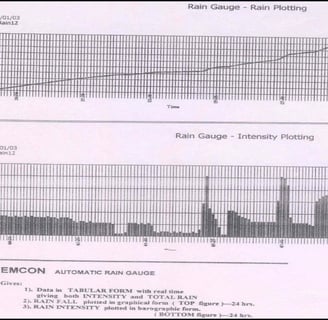
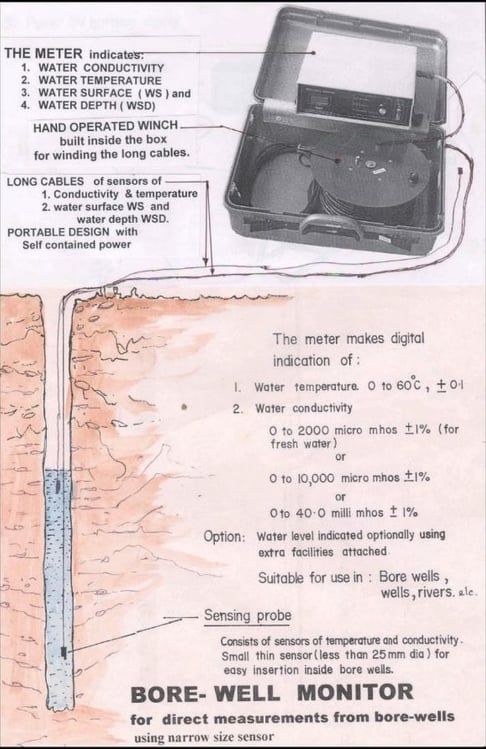
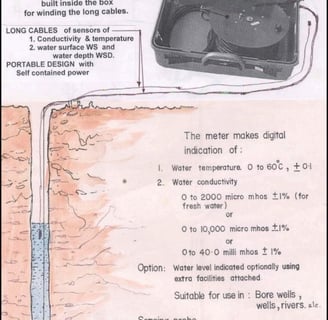
Figure 66: Bore-Well Monitor developed for the National Institute of Technology Karnataka (NITK), Surathkal, for the estimation of groundwater and its quality in Karnataka state.
Figure 67: Environmental Data Acquisition System (EDAS) developed for investigations on numerous natural environmental parameters in open nature. The specialties include: A. Attachment with an EIP (Energy Integration Process), B. Provision to feed data to external accessories, C. Applicability to many prime areas in both open and closed environments, for conducting extensive investigations in an integrated manner, taking into account many related operational parameters.
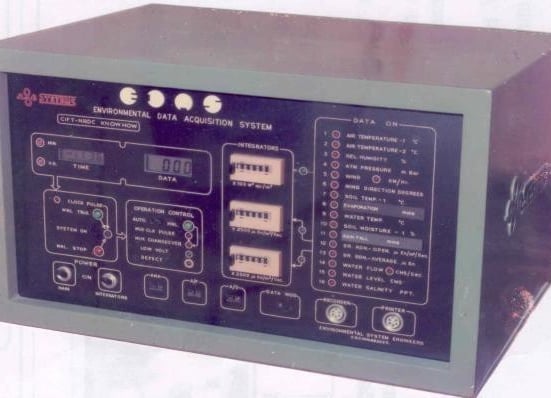
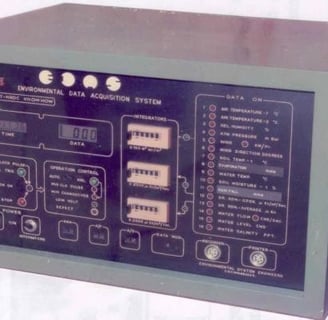
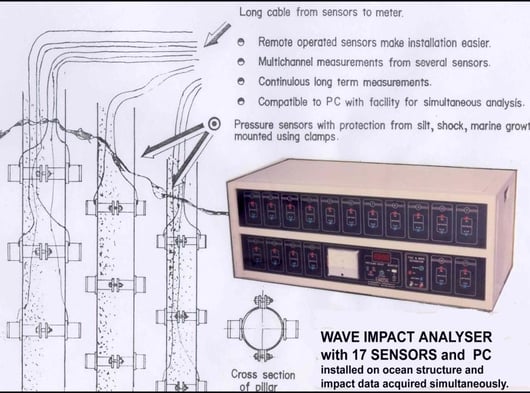
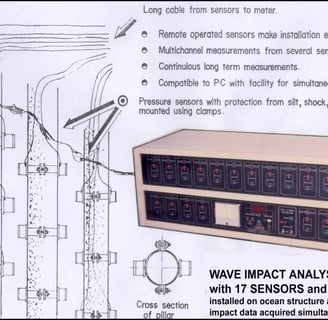
Figure 68: Wave Impact Analyzer developed for the Ocean Engineering Centre of IITM-Chennai for recording and analyzing the impact force of ocean waves impinging on ocean structures, installed for IITM in the Bay of Bengal. The project, carried out by Dr. Lakshmi Narayana and Dr. J.S. Mony, Professors, produced excellent data that were presented at many conferences.
Figure 69: Wave Impact Sensor Bracket developed with 4 separate sensors mounted on ocean pillars, incorporating 17 such sensors as depicted in Figure 69 above.
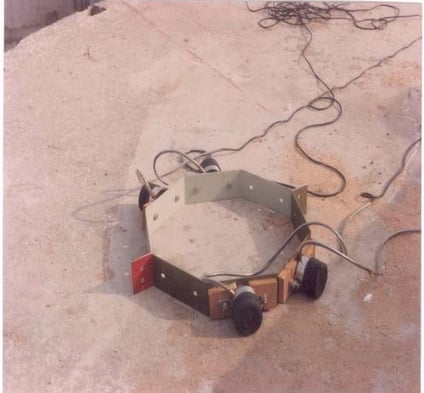
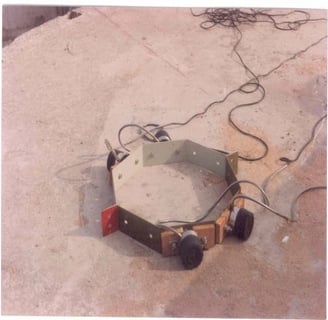
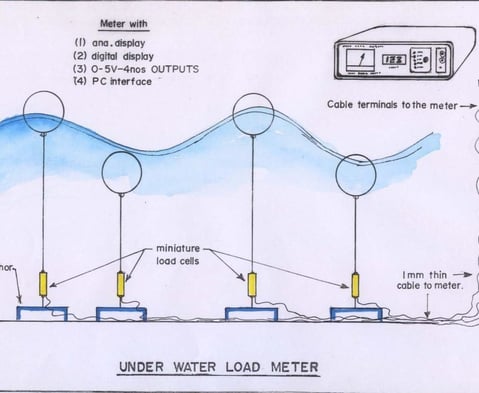
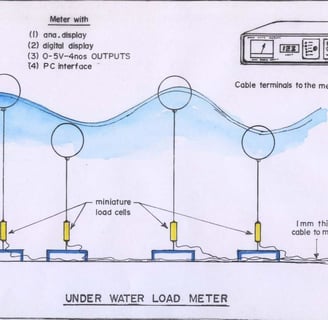
Figure 70: Miniature Type Underwater Load Sensors developed for IITM-Chennai for studies on the buoyancy loads of submerged floats operated in towing tanks. They were developed in miniature sizes, as they were designed without requiring pressure-protected chambers and were exposed to open water, similar to the underwater sensors developed for UMT mentioned in Figure 5.